Objectives of the service

Flood and landslides are among the most impactful natural hazards, causing significant damages to residential, commercial and industrial assets. For this reason, this project aims to develop an integrated system for the spatially detailed assessment of flood and landslide risk. The approach combines three key components: hazard, vulnerability and exposure. The hazard component is quantified through the use of physically-based simulation models. Vulnerability is assessed through the development of vulnerability curves, which link event intensity to the expected damage ratio for different typologies of asset. Finally, exposure is determined by estimating the economic value of assets in every subarea of interest. The risk is then calculated as the product of these three components for every area of interest. So, the final objective is to provide data-driven risk maps to support insurance companies and decision makers in quantifying risk and identifying priority areas for intervention.
Users and their needs
Insurance companies operating in areas exposed to natural hazards increasingly require advanced tools to better understand, quantify, and manage the risk associated with extreme events such as floods and landslides. This project directly addresses these needs by providing insurance companies with high-resolution, quantitative risk assessments for both flood and landslide hazards. So, it enables insurance companies to improve their underwriting processes, define more accurate and risk-based premiums, and develop better strategies for claims management. Furthermore, this project provides trend and up-to-date information about the environment that surrounds insured assets, as well as detailed information about the exposure and the vulnerability for different assets.
Service/ system concept
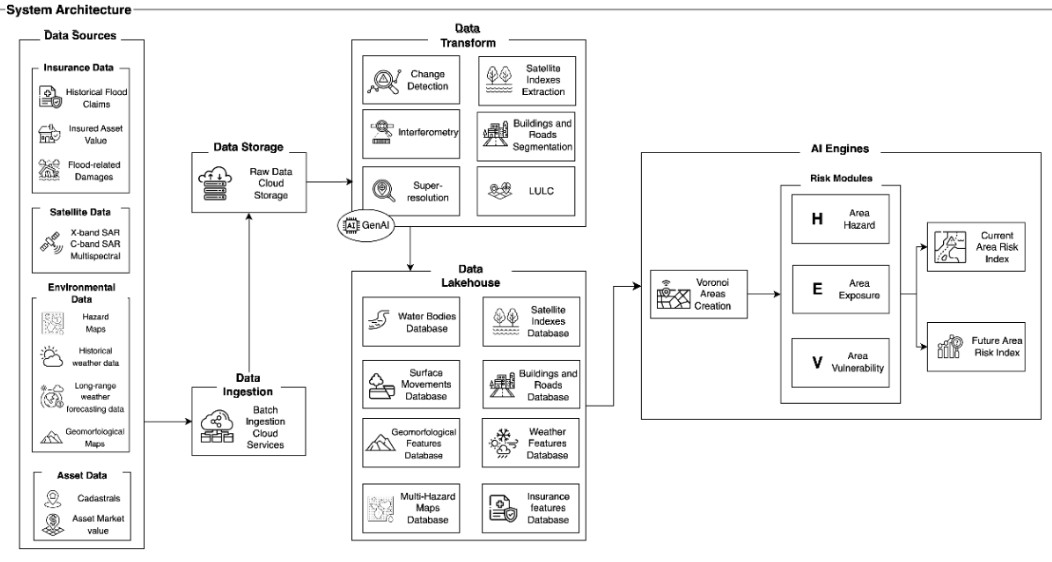
The project utilizes many data sources such as SAR and Multispectral images, insurance data, environmental variables and asset data. All the data is ingested and then stored in an Amazon S3 bucket. At this point many transformations are done with the data, in order to construct a dataset that is useful for the application. The system works by dividing the territory into small zones, called Voronoi cells, each representing a specific area of interest. For each cell, three main types of information are combined:
-
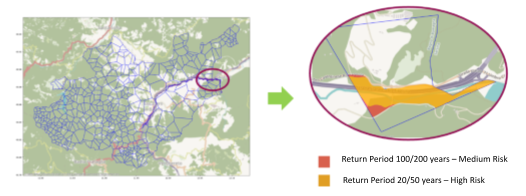
The hazard component, which describes the probability of a hazardous event and its expected intensity, using simulation models based on physical processes, JBA Consulting maps and hazard maps from ADBPO (Autorità di Bacino Distrettuale del Fiume Po).
-
The vulnerability component, which estimates how much damage an event of a given intensity could cause, using damage curves.
-
The exposure component, which measures the economic value of the assets (residential, commercial or industrial) present in every area.
By multiplying these three elements, the system calculates a risk index for each area. This allows insurance companies to identify locations with different values of risk and to make informed decisions when designing insurance products or managing claims.
Space Added Value
Earth Observation (EO) data play a fundamental role in this project, supporting the analysis and mapping of both flood and landslide risk with high spatial and temporal resolution. Satellite radar data (SAR) are used for ground motion monitoring through interferometric analysis, allowing the detection of slow and small terrain displacements. Moreover, SAR data are exploited for change detection, enabling the identification of flooded areas and the estimation of water depth, especially when combined with high-resolution digital terrain models (DTMs). Optical and multispectral data are also essential for land analysis. They are used to calculate specific indices that help characterize the territory. Moreover, multispectral images support land use and land cover classification, essential for identifying the distribution of different land types and human activities across the area. Finally, EO data are used for the segmentation and mapping of buildings and road networks, improving the accuracy of the exposure analysis and asset localization.
Current Status
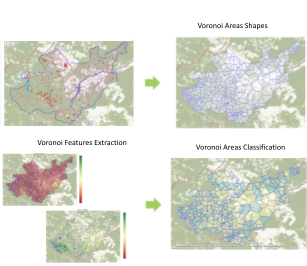
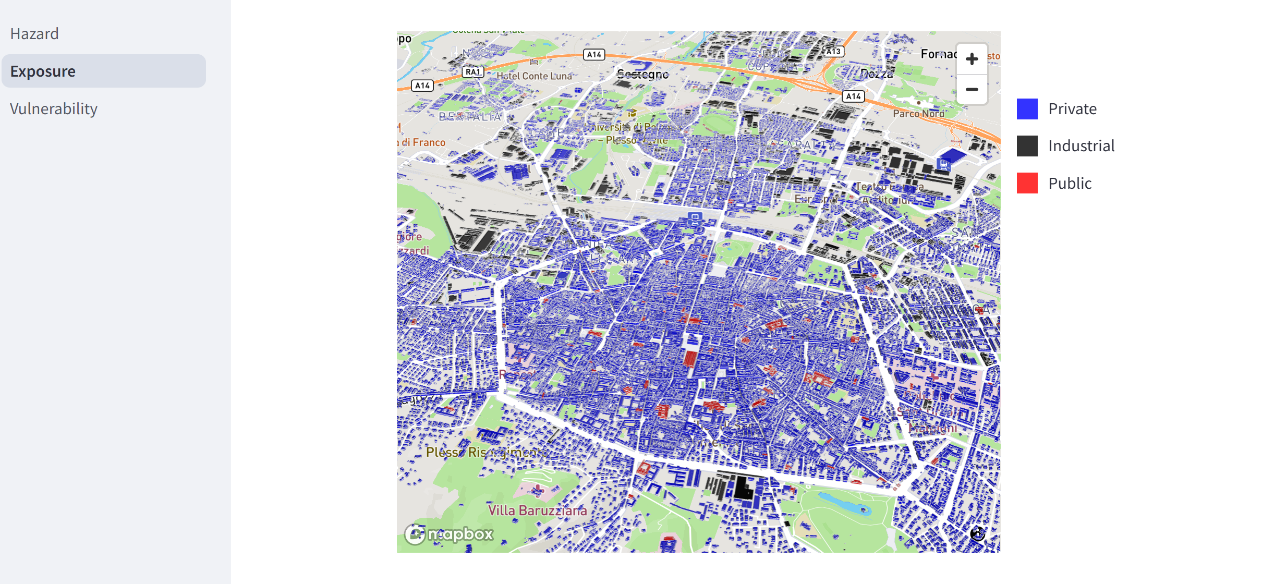
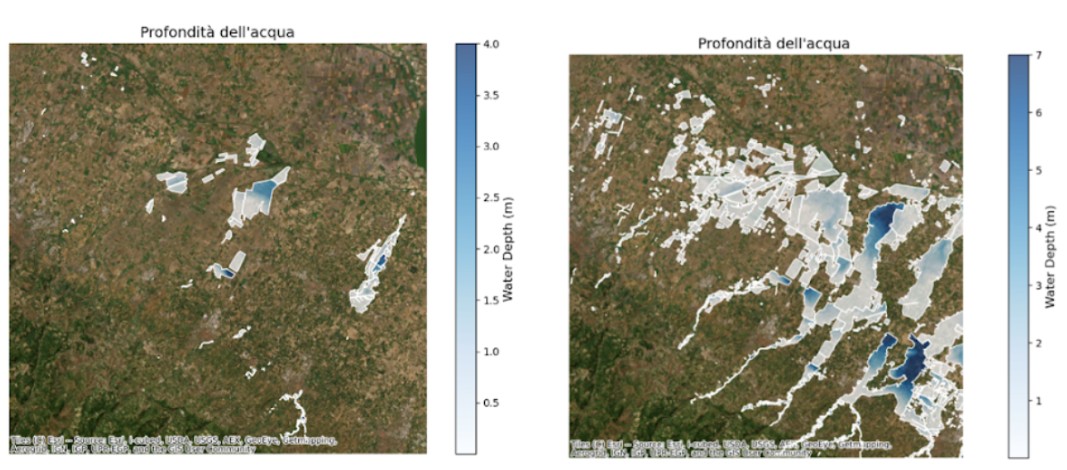
The Voronoi classification of the entire Area of Interest has been completed. The region has been divided into Voronoi cells, each classified using a set of features derived from multispectral and SAR satellite data, including spectral indices, SAR-based indexes, and other relevant variables. This modular framework, which distinctly separates the hazard, vulnerability, and exposure components, represents one of the key strengths of the project, as it enables a transparent and explainable risk assessment process. By isolating each element, it becomes possible to interpret and justify any computed risk score. The development of the hazard, vulnerability, and exposure modules is currently ongoing. For the exposure component, a first classification of buildings into residential, commercial, and industrial categories and the estimation of the average asset value per Voronoi cell is in progress. Regarding the hazard component, available hazard maps provided by ADBPO (Autorità Distrettuale di Bacino del Fiume Po) have been collected, and the setup of physical simulation models is being prepared. For the vulnerability component, flood depths of past events have been estimated, and vulnerability curves per asset type have been developed. In addition to the modular approach, another notable achievement of the project is its scalability: the methodology and modular architecture are designed to be easily replicated for other natural hazards, using the same logic and structure. Looking ahead, future developments will include the integration of Very High Resolution (VHR) imagery and the adoption of Generative AI techniques, such as super-resolution and information scraping, to enhance the granularity and quality of the input data, further strengthening the model’s performance and applicability.