
Objectives of the service
The objective of the AquaMap project is to assess the feasibility of developing a scalable, EO-based tool to support aquaculture site selection and environmental risk assessment. The project aims to integrate EO datasets and products such as water quality, sea surface temperature, bathymetry, and proximity to infrastructure into a unified Aquaculture Suitability Index (ASI). The ASI score helps aquaculture operators identify optimal farming locations in an easily understandable way. AquaMap seeks to address the industry’s challenges, including unsuitable site selection, environmental hazards like harmful algal blooms, and lack of integrated spatial tools. Through technical prototyping and stakeholder engagement, the project tests the potential of EO data for decision-making for aquaculture operators, investors, and certification bodies. A representative test site in Gdańsk Bay was used to test core functionalities, including data harmonization, ASI computation, and suitability mapping. The feasibility study also explores market readiness, user needs, and potential pathways for future product development. Ultimately, AquaMap aims to lay the foundation for a user-friendly tool that enhances sustainability, reduces financial risk, and supports informed expansion in the aquaculture sector that will be further enhanced Very High Resolution (VHR) Marble satellite data by Q3 2026.
Users and their needs
The AquaMap project targets user communities directly involved in marine aquaculture, including:
-
Commercial aquaculture operators (e.g. fish and shellfish farmers),
-
Environmental NGOs and certification bodies (e.g. those assessing sustainability),
-
Financial institutions (e.g. banks and investors conducting due diligence),
-
Research institutions focused on marine ecosystems and spatial planning.
Targeted users are primarily located in Europe, with specific engagement in Poland, Spain and Norway.
A total of over 100 stakeholders were contacted, with multiple in-depth interviews conducted across these sectors. The solution is being developed with input from real users, including fish farmers and certifiers, who provided feedback on pain points and functional requirements.
Key user needs include:
-
Reliable, up-to-date water quality data (chlorophyll, turbidity),
-
Water temperature suitability for specific species,
-
Knowledge of marine pollution risks and proximity to shipping activity,
-
Bathymetric data for site infrastructure planning,
-
Easy-to-use suitability maps for site selection,
-
Integration of sensitive zones (e.g. MPAs) for compliance.
Challenges for AquaMap include:
-
Integrating diverse EO datasets into a unified platform,
-
Addressing the conservative nature of the aquaculture industry,
-
Ensuring high usability for non-technical users,
Service/ system concept
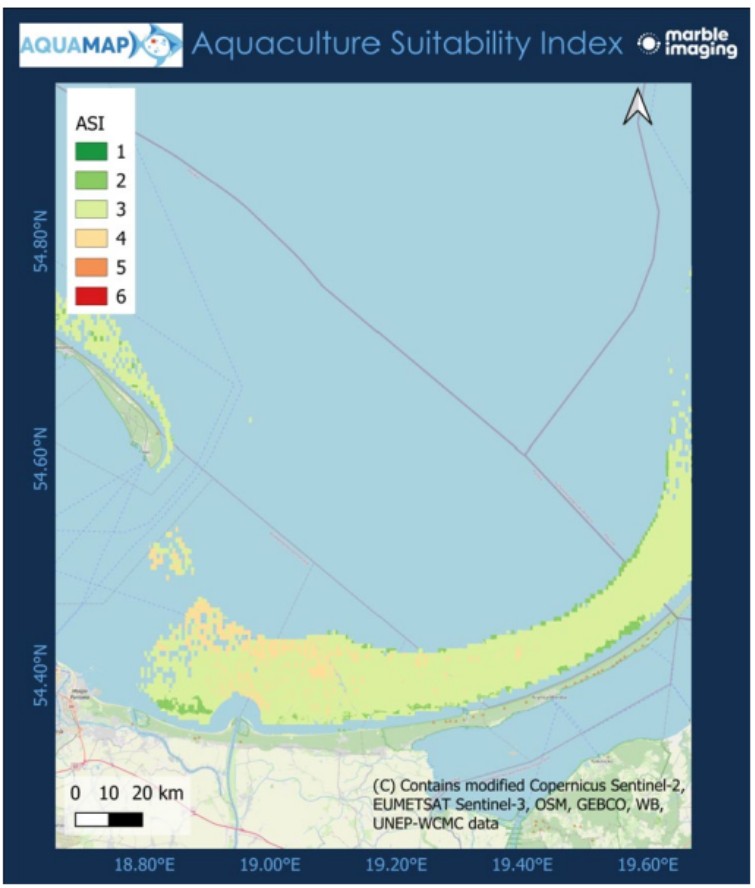
The AquaMap service provides users with clear, map-based information on how suitable different coastal areas are for aquaculture. It delivers an Aquaculture Suitability Index (ASI) that combines key environmental and socio-economic factors such as water quality, sea temperature, pollution risk, water depth, and distance to ports or rivers. Users receive color-coded maps, suitability scores, and risk indicators to help them identify the best locations for fish or shellfish farming.
AquaMap processes satellite images and environmental data into easy-to-read maps and scores. Users are not required to have any prior technical knowledge and hence, the tool is inclusive and accessible for everyone. The outputs can be used for choosing new farm locations, checking environmental risks, monitoring assets or supporting investment and certification decisions.
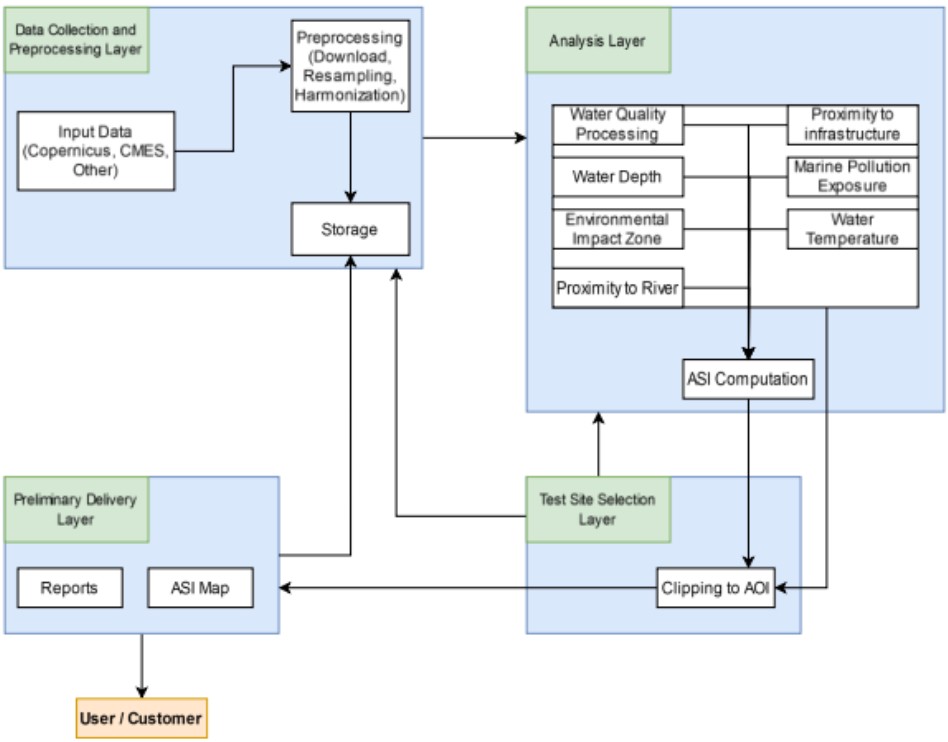
At a high level, AquaMap has four main layers:
-
Data Collection and preprocessing layer: Gathers satellite and environmental data (e.g. water quality, temperature) and preprocesses the data to a harmonised dataset
-
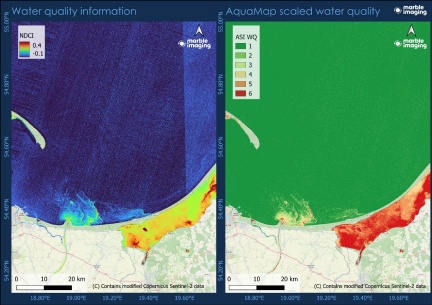
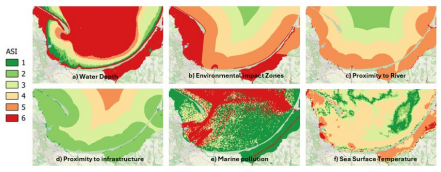
Analysis layer: transforms diverse environmental and socio-economic datasets into a unified Aquaculture Suitability Index (ASI). This process involves a suite of custom-developed tools that extract, process, and spatially analyse key indicators such as water quality (NDCI, NDTI), sea surface temperature (SST), water depth, proximity to sensitive environmental zones, rivers, infrastructure, and marine traffic density. These parameters are derived from satellite imagery, global datasets and other socio-economic datasets and are uniformly harmonized to a 20-meter spatial resolution.
-
Test site selection layer: Each dataset is processed individually with tailored algorithms and clipped to the area of interest to optimize performance and storage.
-
Preliminary delivery layer: The outputs raster layers are then standardized on a scale from 1 (optimal) to 6 (unsuitable) for aquaculture. The final ASI is computed by averaging the scaled layers, while excluding locations with any parameter rated as unsuitable. This process yields spatially explicit, actionable insights on site viability and environmental risk, forming the analytical backbone of the AquaMap tool.
Space Added Value
AquaMap uses multiple space assets, primarily Earth Observation satellites from the Copernicus program. These include Sentinel-2 multispectral imagery (used to monitor water quality indicators like chlorophyll and turbidity) and Sentinel-3 sea surface temperature, supporting species-specific site assessment. Publicly available bathymetric dataset are also used as it complements EO data for depth analysis.
The added value of using these space assets lies in their ability to deliver objective, consistent, and wide-area coverage, which is not feasible with traditional in-situ or manual methods. Current site selection processes are often based on limited field surveys, expert judgment, or fragmented data, leading to suboptimal decisions and higher risks. By combining multiple satellite datasets, AquaMap provides scalable and reproducible methods to assess aquaculture suitability offering information that is both spatially detailed and regularly updated. This integrated EO approach reduces costs, improves risk management, and allows users to assess large regions efficiently, giving AquaMap a significant advantage over conventional labour-intensive methods.
Current Status
The AquaMap project has completed its feasibility phase, including development of a prototype that generates aquaculture suitability maps based on EO data. A pilot was successfully conducted in the Gdańsk Bay region, where core components, such as water quality, SST, depth analysis, marine protected areas and pollution risks, were tested and integrated into the Aquaculture Suitability Index (ASI). Over 100 stakeholders across Europe were contacted, with 12 in-depth interviews conducted to shape functionality and value.
Outputs were visualized in QGIS using harmonized geospatial layers.
