
Objectives of the service
Use a bold image to start your webpage. It can be a photo or an infographic like this. Remember that your project webpage can be a powerful marketing tool.
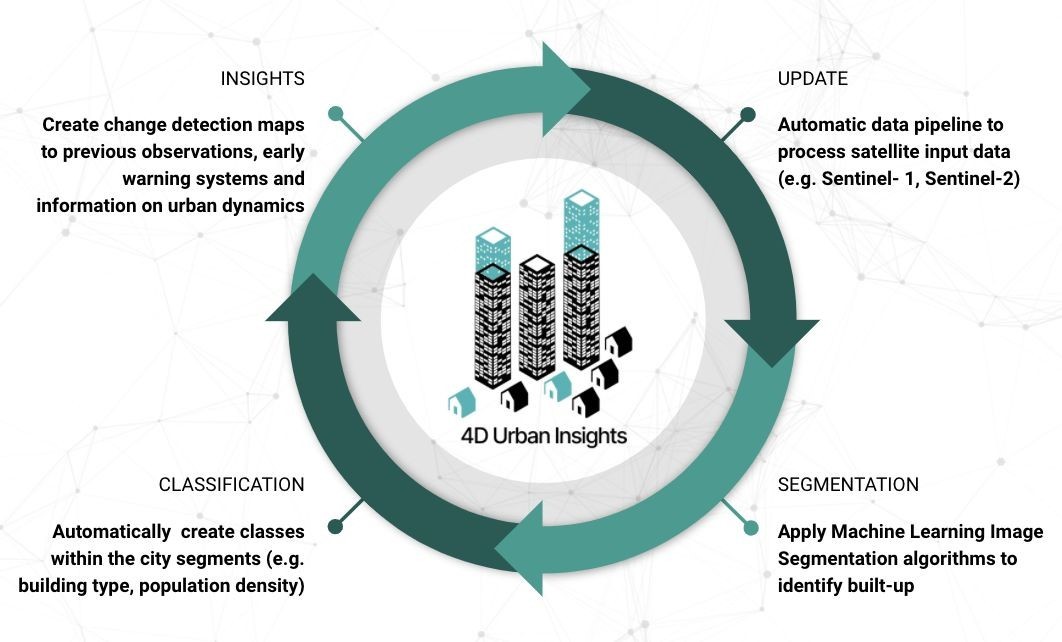
In fast growing cities, urban planners have the challenge to keep track with urban growth and to provide basic infrastructures such as sanitation, electricity or public schools. 4D Urban Insights is a software that automatically analyses city growth in horizontal spread and vertical height by analysing satellite data with Machine Learning.
Users and their needs
4D Urban Insights users will include GIS specialists that collect spatial information for decision making. Urban Planning, Retail Store Location Managers, Actuaries at Reinsurance companies or Analysts at International Donors such as The World Bank or the UN need this information to fill information gaps that appear from missing aerial imagery in short time intervals. These users often make predictions on city development, 4D Urban Insights provides insights into the dynamics of urban growth.
Service/ system concept
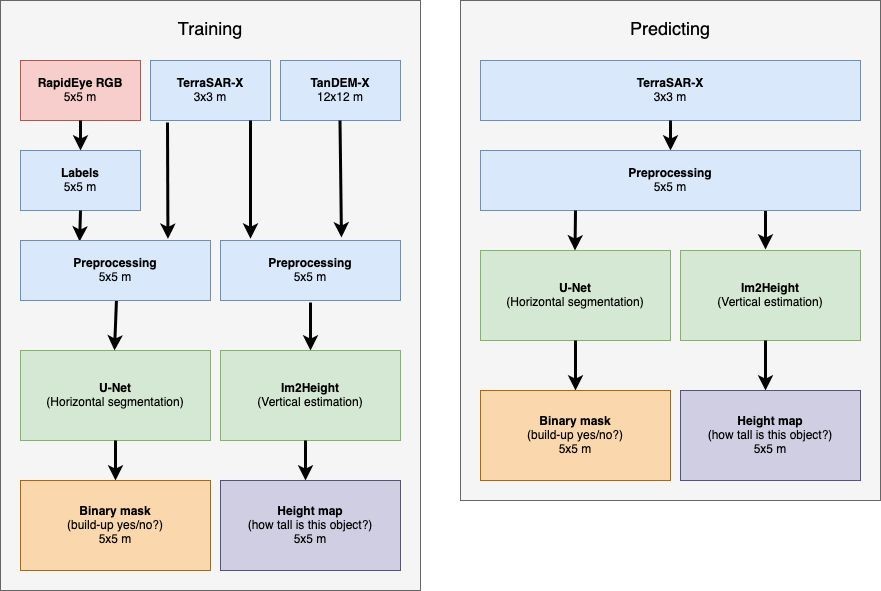
Image credit: dida Datenschmiede GmbH, 4D Urban Insights project
The technical architecture is constituted by two convolutional neural network models: one detecting horizontal spread and one that estimates vertical elevation. The two models are trained on large data sets whereby it is provided both input and target output. The training works as follows: after feeding the network an image, it predicts what it thinks the output should look like, the result is then compared with the true target output, from which the network then gradually learns by it’s mistakes and successes. After the training is done, which means the model doesn’t improve as the training continues, we use it to predict urban sprawl on new, unseen images. If the networks have learned to generalize it’s knowledge well enough, by being exposed to a large variety of images, it should be able to do so with good accuracy. By then feeding the networks multiple images taken over several years it is possible to detect and highlight changes in the cities and therefore monitor the growth of these.
Space Added Value
The satellite data sources that were used includes RapidEye (5x5m visual), TerraSAR-X (StripMap) as well as TanDEM-X (12x12 m). We used the RapidEye data for labelling, because of the visual spectrum which in contrast to radar images are easily digestible for the human eye. However the cities monitored in this feasibility study are covered by clouds through large parts of the year, which hinders the monitoring. In order to detect urban development at steady timesteps, we therefore rely on TerraSAR-X (StripMap) data as input to both models since radar can penetrate through clouds and give us images in any weather. The neural networks we use are still able to learn from these radar images and can be fed images at a higher temporal frequency, compared to images occluded by clouds. The TanDEM-X elevation data is used to help train the vertical elevation model by feeding in large sets of data covering all cities as well as surroundings.
Current Status
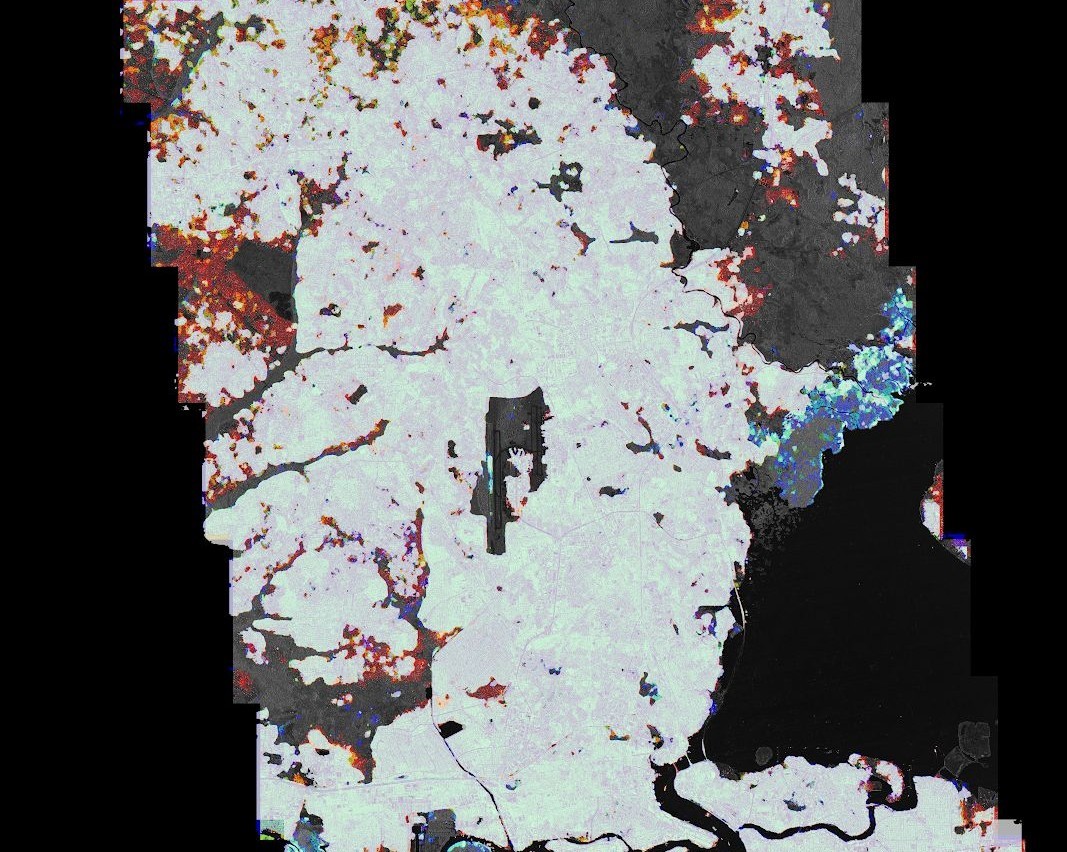
Image credit : dida Datenschmiede GmbH, 4D Urban Insights project
In the kickstart activity, research showed that the customer segments have very different requirements in terms of data needs. However, the desire for more accurate and up-to-date information was obvious. Next step for the team is to configure a feature set that allows commercialization. For this, dida will partner with an experienced Geoinformation company to collect insights into the exact requirements of the high demand customer segment of urban planners.