
Objectives of the service
Air pollution causes 467.000 deaths in Europe each year. Once a silent and underestimated killer, it is now recognized as the single biggest environmental health risk. But there is hope. Scientific research has shown that reducing your exposure to air pollution is effectively helping. But how to do that?

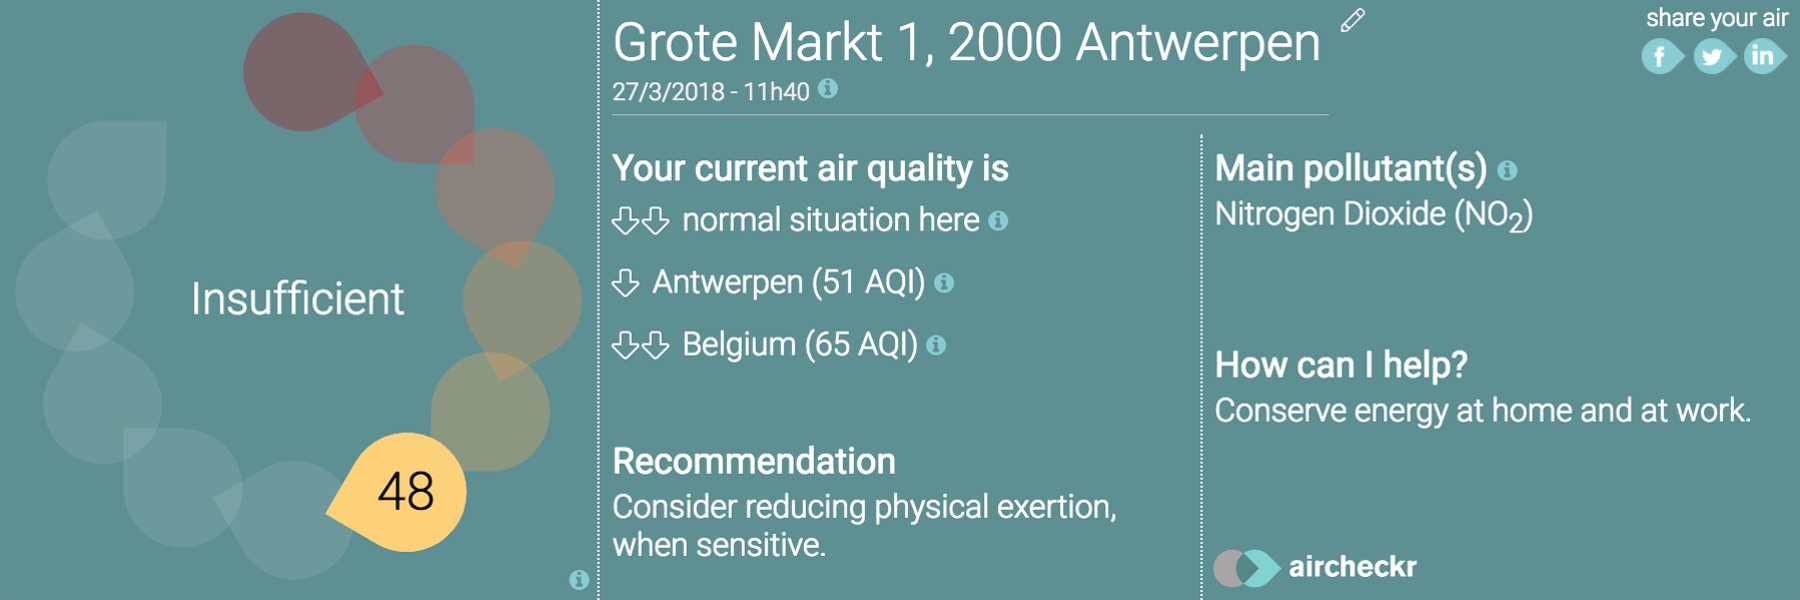
The air quality data available today are mostly not suitable for personal use or implementation into a business context. aircheckr changes this completely with its real-time air quality information up to street level. The aircheckr algorithms calculate the air quality information at different levels of detail: real-time, forecasting or statistics. The aircheckr Air Quality Index translates the complex set of pollutant concentrations into a health-based and easy to understand number. Personal recommendations and hints allow people to take adequate actions if needed. The air quality data can easily be integrated in different applications through an extensive API and widget.
Aircheckr has also developed an Air Quality data interface. This interface can connect to the aircheckr services as well as other AQ data services, including AQ sensors. It supports users to better understand and monitor air quality in their area of interest.
Users and their needs
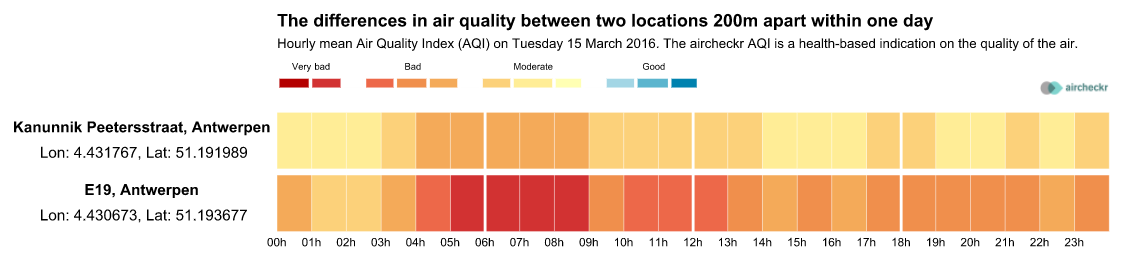
The effects of air pollution are alarming, mainly affecting the respiratory & cardiovascular system. In Belgium alone, every hour at least one person, on average, dies due to air pollution. Many people are concerned but feel helpless to act accordingly. When you drink and drive and you have a car accident, it is quite clear what the cause is, but with air pollution this is not so straightforward. Air quality is very complex. There are many different pollutants and their effect on health is not always clear. Moreover, air quality varies a lot in time and space. The air pollution next to a highway at rush hour can strongly differ from these in the park 200 meters away (see example below).
Aircheckr is focused on B2B and B2C. Below some targeted markets are highlighted:
- Digital signage
- Real Estate
- Ventilation
- IoT & smart cities
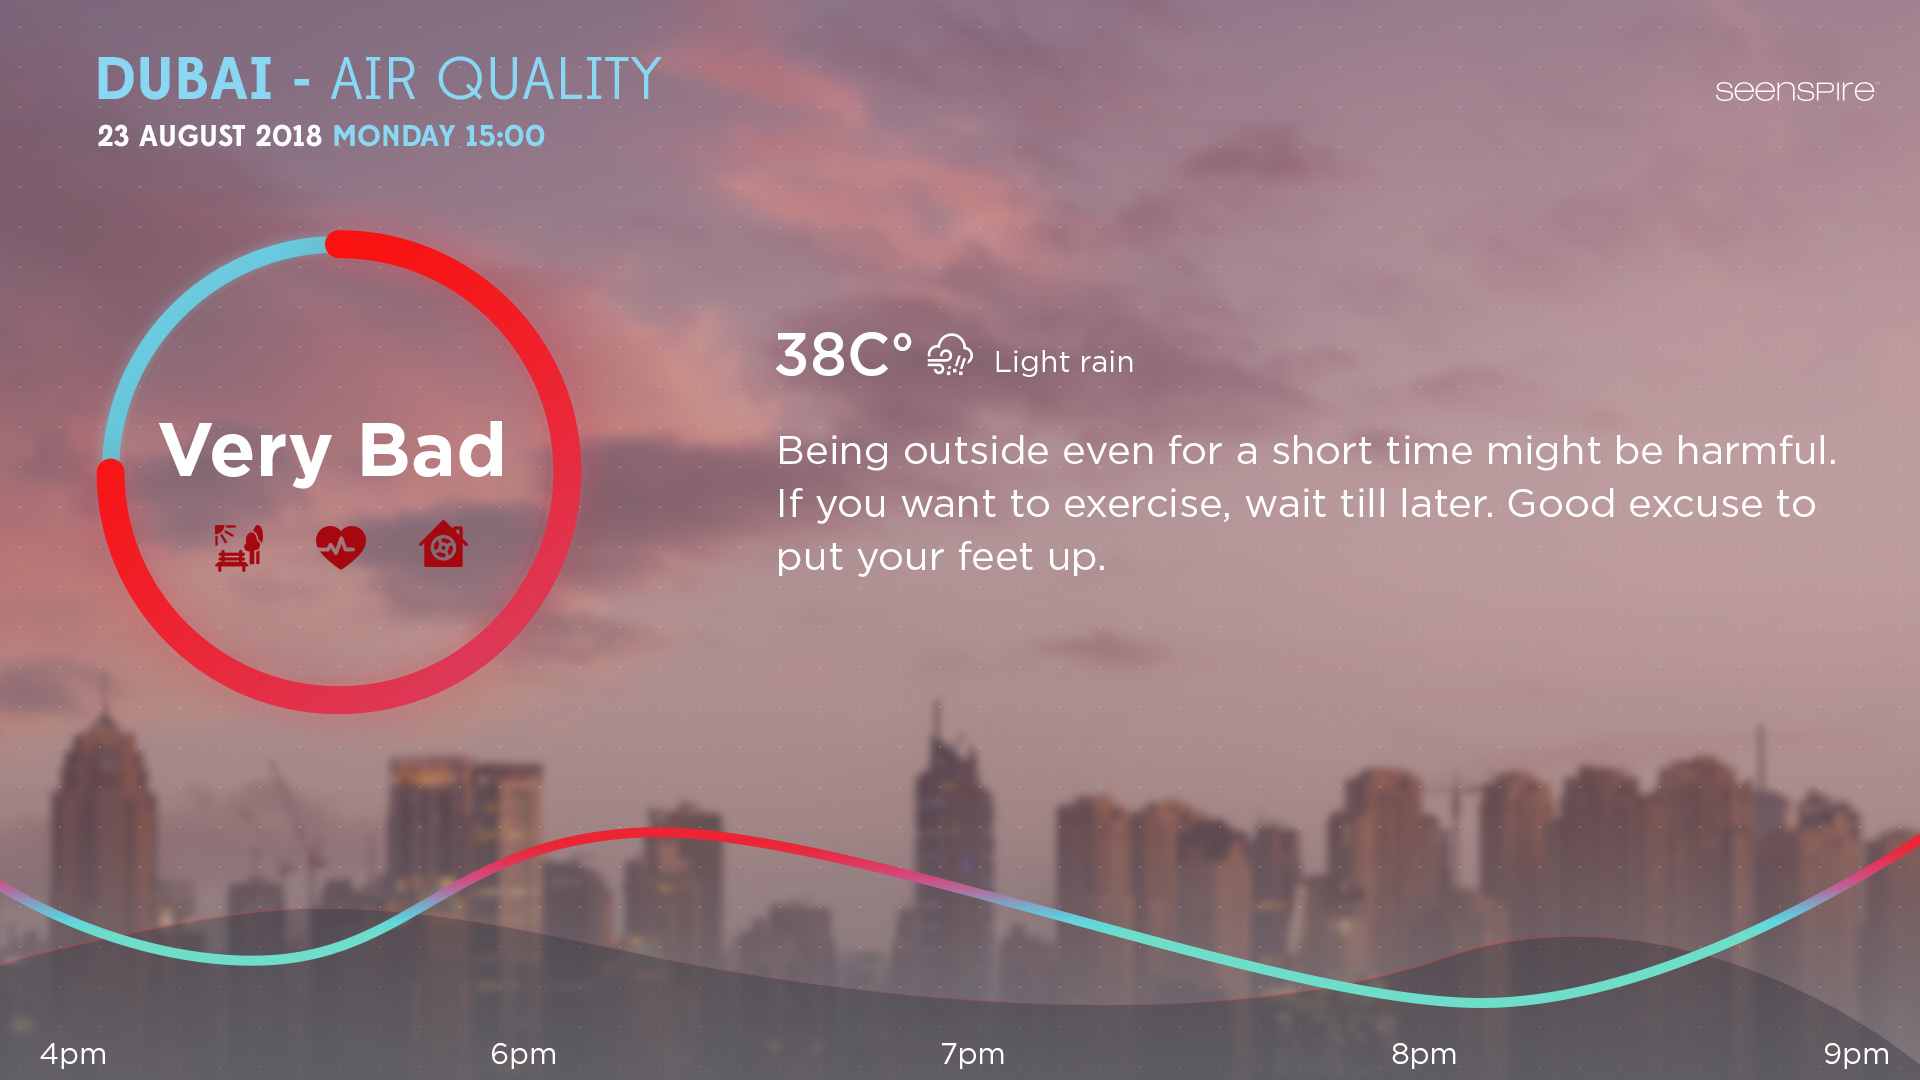
All of them need AQ data to enhance their services/products. The specific needs depend. For the real estate market e.g., an aircheckr widget gives for each property for sale/rent at a real estate website a clear indication on the air quality status. It is a real asset to “jump out”. In ventilation applications aircheckr makes it possible to integrate outside air quality information as an additional parameter in the automation of ventilation systems. This can improve the inside air quality considerably as ventilation can be reduced when outside air is bad (and the other way around). Several customers (e.g. integration of aircheckr by digital signage expert Seenspire in figure below) in different markets were involved in this demonstration project to demonstrate the potential of aircheckr.
Target area: Belgium/EU/Global
Service/ system concept
aircheckr answers the following question: “How to know the air quality now, right where I am and what does that tell me?” Aircheckr provides the best air quality data (e.g. on street level for Paul who is planning his running route). It is location-based (“right where I am”) & real-time (“now”). Moreover, aircheckr makes the data easy to interpret and gives personal recommendations (“perfect air for a run”).
The system architecture is quite straightforward. Different businesses need AQ information as an input for their service. The aircheckr API allows communication between the users’ device & the aircheckr servers. Directly after a request is send from a user device, a fast, on-the-fly and request-based processing technique will generate a location-based “response” that is send back immediately to the users’ device again. The aircheckr AQ data(base) are the result of intensive processing, where different existing AQ (and other open) data are modelled and enriched with crowdsourced local (sensor) data & Earth Observation derived contextual information.
Space Added Value
Aircheckr makes intensive use of 2 space assets: Earth Observation & Satellite Navigation.
In the aircheckr methodology, Earth Observation derived Land Cover maps play an important role. The Copernicus product “Urban Atlas” is providing pan-European comparable land use and land cover data for Large Urban Zones with more than 100.000 inhabitants at a resolution that is 100 times higher than CORINE land cover. Moreover, the Copernicus Atmosphere Monitoring Service (CAMS) is delivering valuable air quality data at European scale for several relevant pollutants.
Satnav technologies is primarily used to track the precise location of individual users accessing the aircheckr database through an API or widget. Moreover, the positioning of newly installed sensors is key.
Current Status
Overall goal of this project was to design, develop, demonstrate and validate the pre-operational service aircheckr.
The demonstration project started June 2016 and ended successfully in July 2018. Besides a huge amount of technical advancements, several demos demonstrated the potential of aircheckr in different market segments.
In April 2019, a Contract Change Notice was activated to include the following new features:
- Integration of alternative air quality data coming from local data sources like sensor networks
- Build an air quality data visualisation interface tailored to the needs of smart cities
- Extend the aircheckr activity area to a global coverage
The pilots for the “AQ data interface” for cities and the “Integration of AQ sensor data in the AQ data interface” were successful. Both pilots have resulted in a live product which is now running as a prototype.
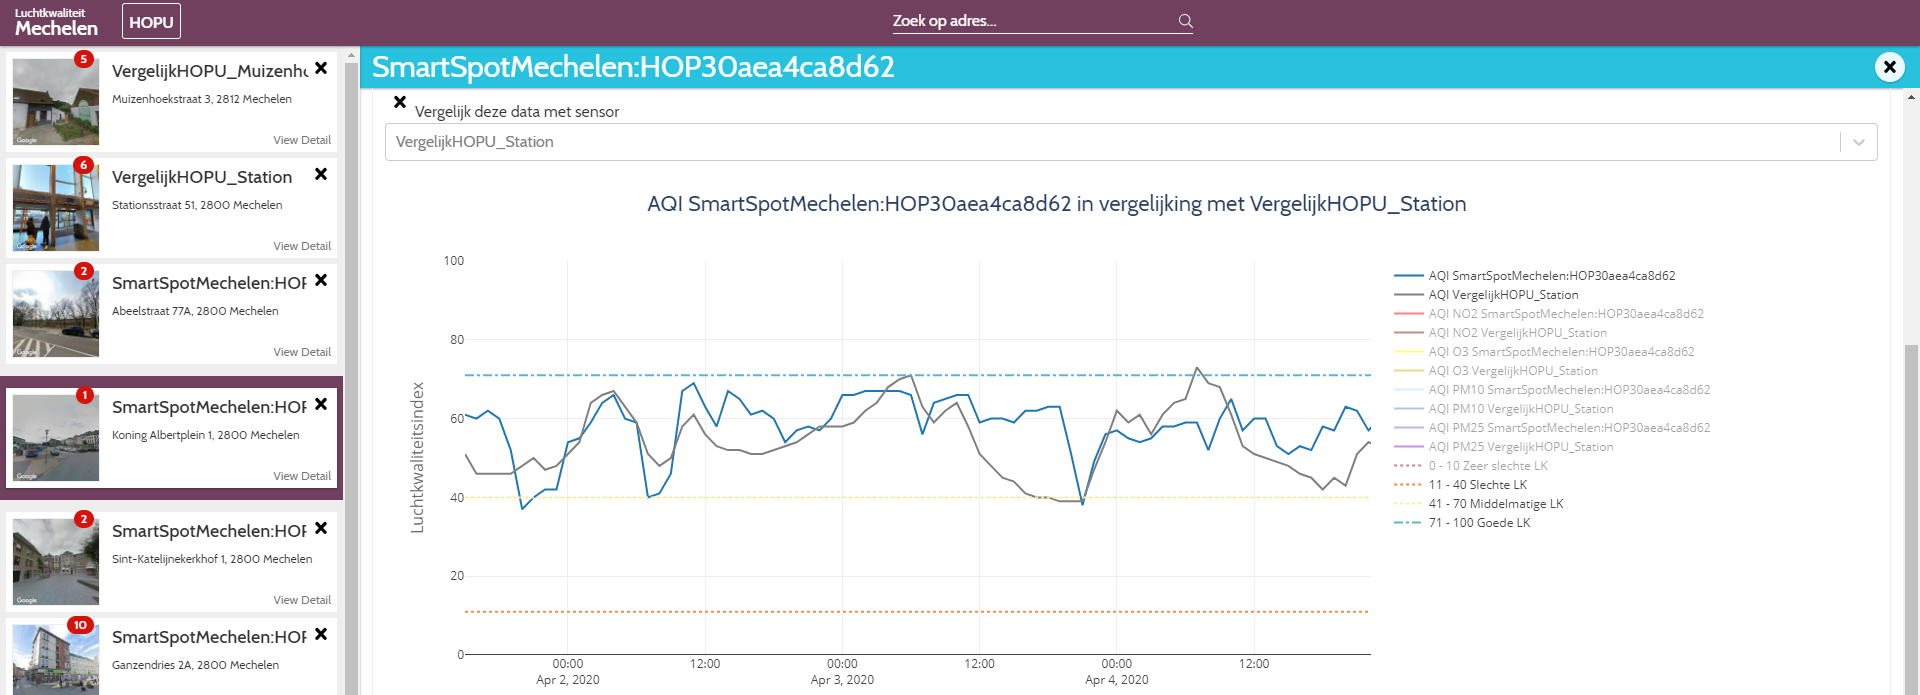
The newly developed AQ data interface leaded to a successful integration of the AQ data in the interface and a successful evaluation of the user. It allows the user to place “virtual sensors” that monitor air quality on an hourly basis and allows to track back the historical air quality at street level in relation to WHO norms. It also allows the integration and comparison with in-situ sensors installed on the terrain.
The integration of the external in-situ sensor data leaded to a (i) correct and real-time integration of installed AQ sensors in the aircheckr AQ data interface, (ii) a successful harmonisation with the aircheckr AQI and (iii) an easy-accessible methodology to compare AQ sensor data with modelled AQ data
The “Global access to AQ data” integration needs additional Research and Development. The availability of high-quality global air quality data is a key requirement in order to provide end-users with site-specific informative air quality information. Based on a study conducted over Belgium, the quality of the envisaged Global AQ data source does yet not meet these requirements. The validation results suggests to first improve / fine-tune this source before integration into the Aircheckr architecture. The use of machine learning to correct for local variability and model biases is being considered.
Please visit the aircheckr website (www.aircheckr.com) to check your local air quality and/or register to our newsletter for more info
Prime Contractor(s)