
Objectives of the service
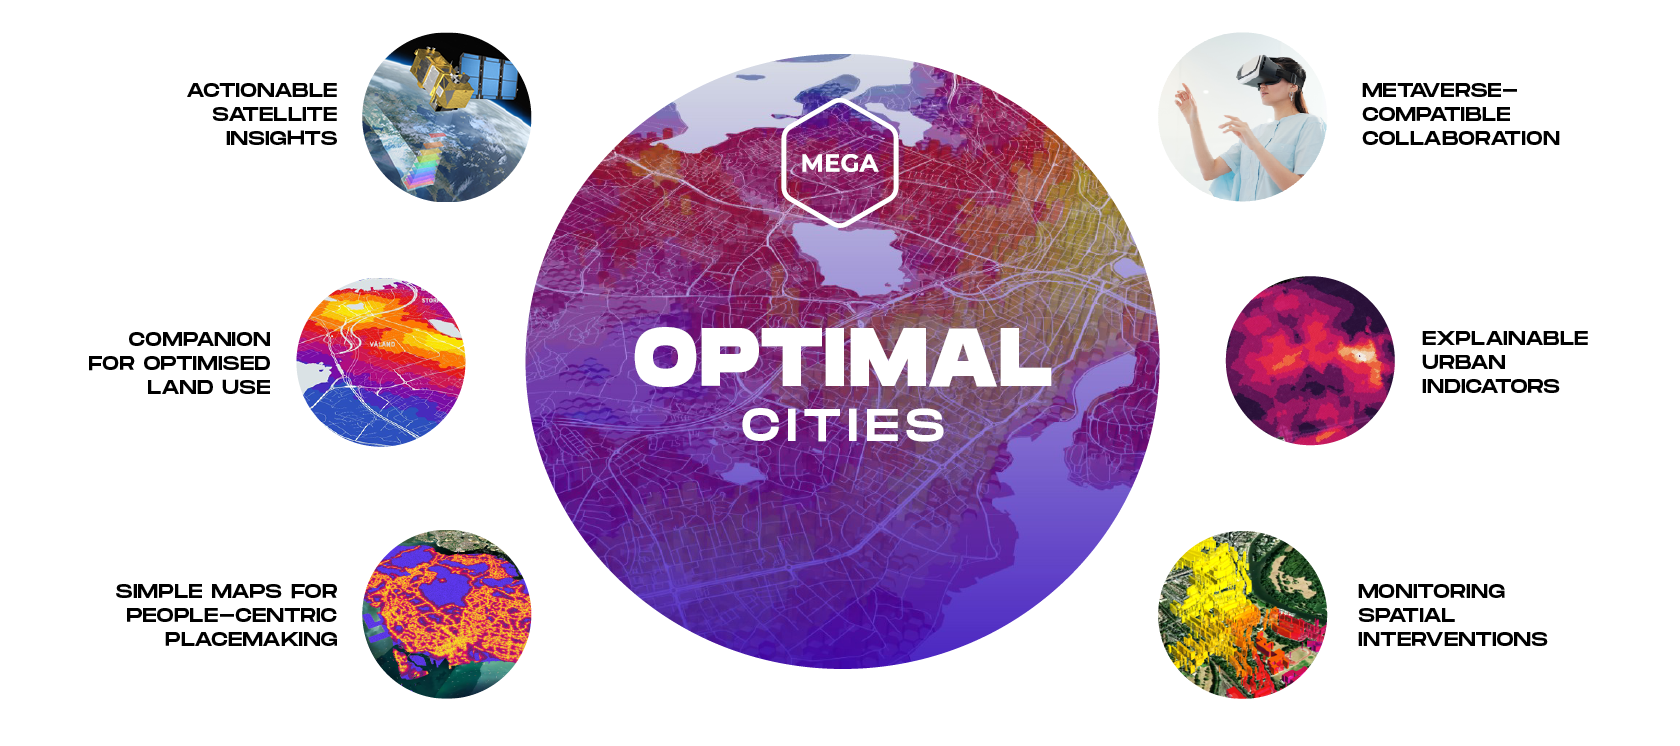
Optimal Cities enables placemakers, specialists and stakeholders to analyse, plan and develop thriving and vibrant cities with reachable and adequate places to live, work and relax, while engaging local communities.
Users and their needs
Our team engaged with over 70 people from thirteen countries (Norway, UK, Kingdom of Saudi Arabia, USA, Singapore, United Arab Emirates, Algeria, Mongolia, Vietnam, North Macedonia, Romania, Bangladesh and Germany) - including governments, local authorities, mayors, vice-mayors, landscape planners, urban planners and designers, technologists, innovation agencies, ambassadors, medical professionals, directors of top engineering and design companies – in order to determine what they need to make reliable decisions faster, analyse and optimise cities.
The main user needs were related to having access to:
-
A companion for decision-making and explainable analytics
-
Drawing tools for collaboration and engagement
-
Reliable data catalog of environmental and regulatory constraints
-
Actionable insights from multispectral satellite imagery
-
Data export tools for industry standard GIS, CAD, 3D and XR software
-
OGC-compliant API connectors
-
Tailorable and explainable GIS analytics
-
Secure and shareable digital maps
Service/ system concept
The user selects the cities they want to use for collaboration and analysis. Once selected, they have access to Optimal Cities ATLAS and STUDIO linked interfaces. ATLAS provides a variety of domain-specific individual urban indicators, Optimal Cities predefined scores and score tailoring tools. STUDIO includes secure drawing and collaboration tools, where the users can add indicators and scores from ATLAS, locally-specific data from the cloud-based data catalogue (such as geospatial layers, satellite imagery) or import and export their own content.The scores and drawings saved from Optimal Cities can be combined with industry standard GIS, CAD, 3D and XR software and datasets.

Space Added Value
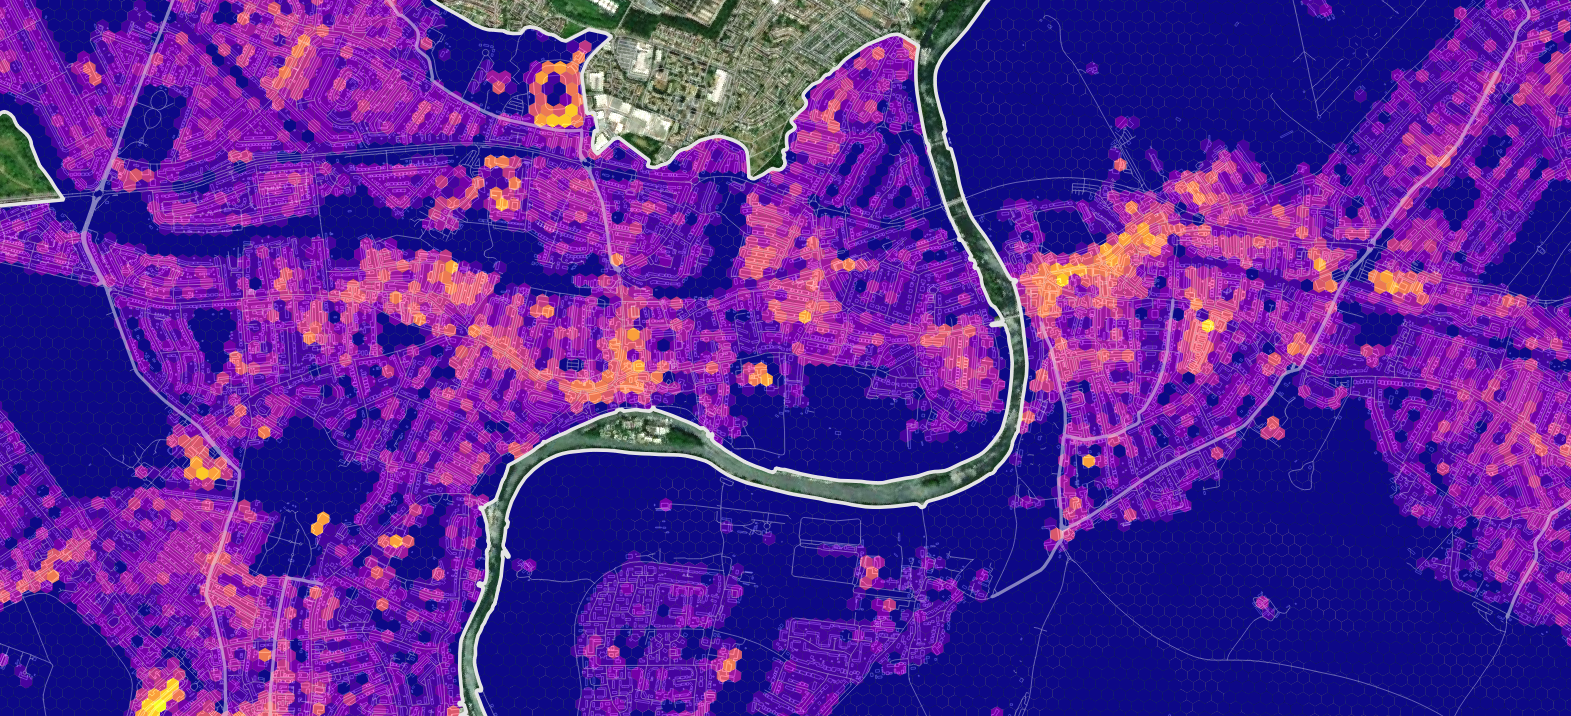
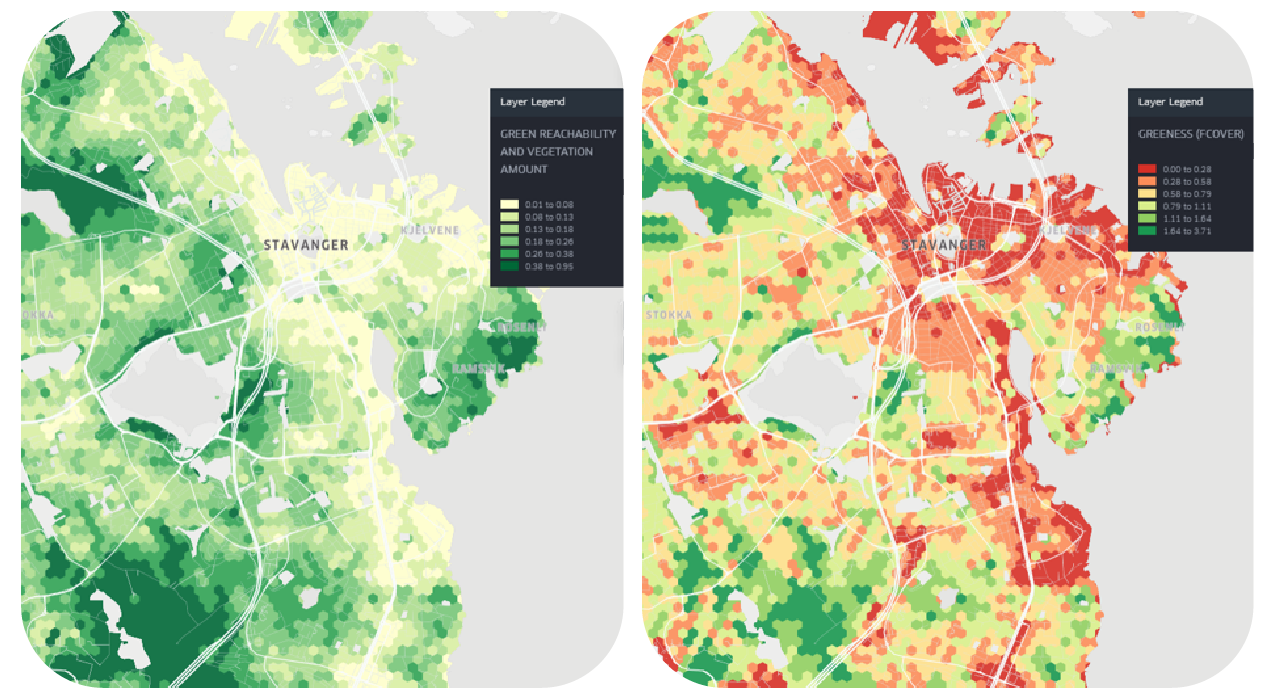
The green spaces and environmental assets are often recorded as simple 2D polygons and evaluated by their area extent and location. Space assets provide tremendous value by enriching the information about green and environmental assets with spatio-temporal data about the qualities, health and density of vegetation. Thus, the understanding of the capacity to provide health and environmental benefits in an area is significantly improved. Optimal Cities is using cloudless Earth Observation data, Sentinel-2 and 5P to annualise indicators and monitor the change of vegetation indices, built-up area, heat island risk, vegetation health for green spaces and air pollution levels. The data provided through the Copernicus program of Land and Air Monitoring is used to analyse land-use changes and air quality for city and district-wide health risk measurements.
Current Status
Our team engaged with a wide variety of potential end-users and customers interested in using the solution for monitoring, urban farming, climate change mitigation, digital transformation and engagement, public health improvements, housing, mobility, access to healthcare and other key services, identifying infrastructure weak points and site identification. We identified the top priority customer segments amongst them (cities and urban planners) to focus on.
We developed and stress-tested tens of interactive web maps to develop an intuitive, reliable and actionable service that can be understood by anyone and applied anywhere in the world – by integrating cloudless satellite imagery combined with standardised urban indicators, optimal scores tailored for decision making and content management systems to draw securely.