Objectives of the service
The SAMoH platform gets satellite EO into the hands of non-exprts tasked with understanding and managing the natural environment. It enables customers to pre-process freely available EO imagery for their area of interest, create Analysis Ready Data (ARD) and build a data cube for analysis and visualisation using a web-based client application. Users are able to quickly assess and monitor habitat change over time using spectral indices and other metrics, enabling the gathering of evidence to understand existing and potential pressures on habitats and associated wildlife populations.
Tools on the platform enable users to visualise change along transects, at random points or certain areas of interest based on a range of pre-calculated and readily available spectral indices.Users can also target areas requiring more detailed survey information from UAV’s and third-party dataset such as LiDAR data or very high resolution commercial EO imagery. Visual comparisons between dates and seasons are easy to do and easy to export. Standard deviation of change is easy to calculate and hot spots of change over the users area of interest are easy to identify. Visually appealing graphs of change through time along a transect for example can be exported and added to reports.
Users and their needs
Many potential users of satellite EO currently choose not to use limited resources to search, access and process satellite imagery. Other barriers include time, lack of required skills amongst staff, and the storage and processing requirements involved, yet, awareness of the availability and potential of satellite imagery archives is increasing.
Archives of free satellite EO is increasing; there is a clear need for cost effective, intuitive tools to allow the visual exploration of these archives along with the potential to add third-party datasets e.g. UAV missions or VHR commercial EO.
SAMoH anables users to create ‘analysis-ready-data’ (ARD) and makes use of Open Data Cube technology. This is an effective solution for storing large volumes of imagery in a way that makes it quick and easy to analyse change in environmental phenomena. Cloud services are utilized to offer quick and scaleable solutions.
SAMoH enables the user to more easily:
- Identify, visualise and quantify rates of change over time in habitat extent or condition;
- Identify, visualise and quantify rates and/or extent of habitat restoration or ‘bio-restoration’ efforts;
- Evidence previous change over time/evidence impact of management decisions over time; and
- Monitor change over time.
Environmental managers working on projects all over the world can use SAMoH services.
Service/ system concept
The products/services provided by the SAMoH platform (products and services) can be broken down into the following headlines:
- Online platform to access satellite imagery archives
- Online platform that uses Open Data Cube technology
- Cloud storage and cloud processing
- Functionality to visualise environmental change
- Functionality to create graphical outputs
- Interoperable software and open source code
- Consultancy Services provided by GSD
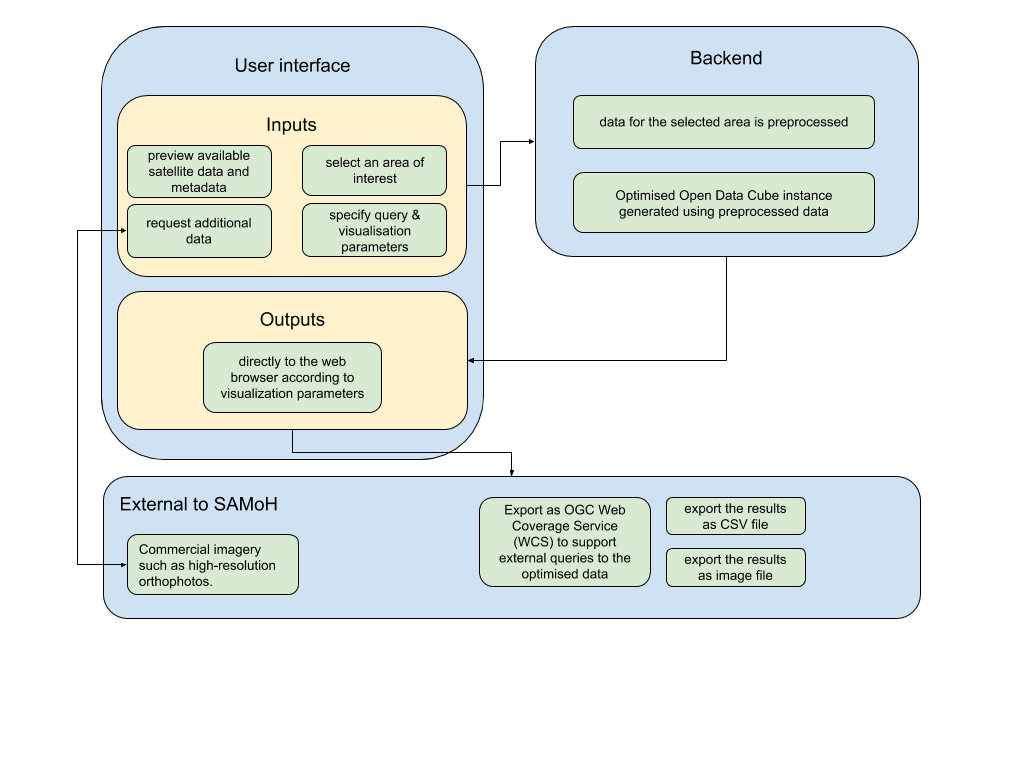
The high level block diagram below illustrates the principal parts of the proposed architecture. This provides an indication of how the user might interact with the SAMoH system and what tasks might be undertaken to generate usable output.

Space Added Value
The SAMoH system makes use of freely available imagery from USGS & NASA- Landsat and imagery from EU & ESA – Sentinel. Data from NASA’s Terra satellite MODIS can also be accessed using the platform. There is the ability to offer access to any set of imagery that has been made accessible and freely available – this also includes access to third party commercial imagery through partnership agreements and appropriate pricing mechanisms.
Other functionality includes the ability to ingest UAV data collected from privately arranged missions over the same area of interest over time in order to make use of the analytical and visualisation tools in SAMoH. Other space assets could include imagery from HAPS for example or airborne campaigns such as LiDAR.
Having one platform to access multiple data sources is beneficial to SAMoH customers and time is saved as image processing and stacking is carried out for them in the backend. With the easy to use transect, point and area tools, the user is free to explore change over time at will and export visually appealing graphs and maps to illustrate and evidence change at their site.
Current Status
SAMoH has just reached the end of ESA Kickstarter phase. It began March 2018 and ran for six months. Work included a User Engagement study a Technical Feasibility study - including the development of a prototype - and a Business Plan.


