
Objectives of the service
The features that are attractive to customers are the easy access to information on crop development using a simple API. Another attractive feature is the visualization tools prepared, that allow for customers to immediately try products and show them to their clients (ex: https://aquafarm.hidromod.com/wms.html and https://aquafarm.hidromod.com/MapViewer/). De fact that customers can see historical date is also valuable. The pre-processing of data for each field is obtained from IFAP Land Parcel Identification System (LPIS), which is very practical for farmers as they are used to that identification system. Nevertheless, AQUAFARM can ingest customers’ defined polygons.
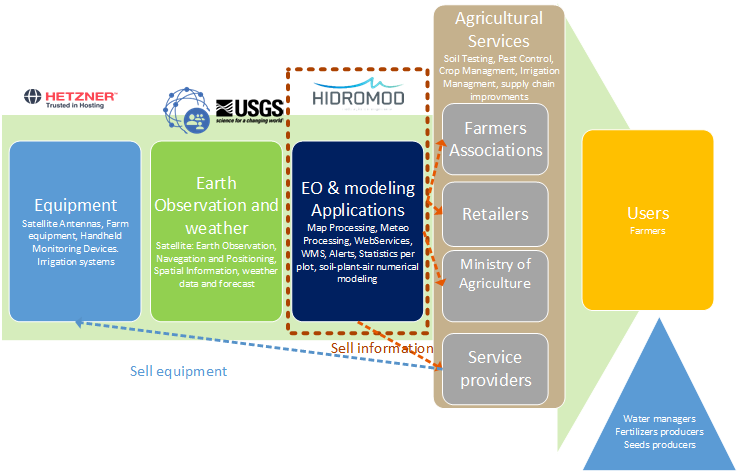
AQUFARM integrates data from satellite, meteorological models, meteorological measurements and plant growth models to provide modelling results about plant and soil. It has versatile interfaces of input and output that allows managing different models and data. AQUAFARM can make this available anywhere in the world. The system can also be connected to in-situ data. AQUAFARM can learn with the historical data on productions, increasing its forecast accuracy. AQUAFARM can be used by other platforms that distribute information to farmers.
Users and their needs
AQUAFARM improves access to data and models (which have low maintenance costs and high durability when compared with intensive measurements based services) to support four identified users (Retailers, Farmers Associations, Ministries and Service Providers) that all together help improve the value chain. With this information, users gain the possibility of monitoring farms and their production thus improving value chain and simultaneously helping retailers to better control supermarkets’ supply chain by anticipating changes in quantity or quality of production. During postharvest, environment monitoring is also paramount to guarantee that products are subject to optimum climate conditions. On the farmers’ side it allows a proactive reaction to stress factors in order to maximize production. On the ministries side it allows a continuously monitoring of crop development, helping to solve specific problems with subsidies.
Portugal, Brasil and the world.
Service/ system concept
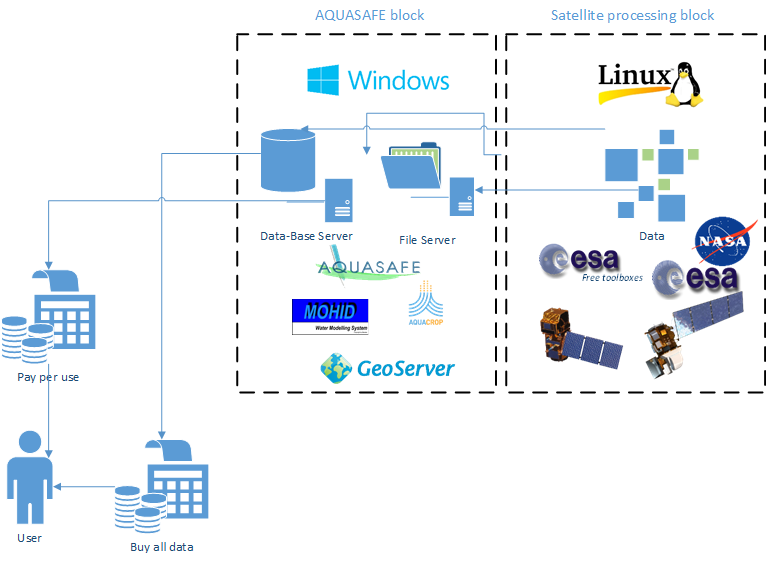
AQUAFARM Operational System is composed of two main blocks: Satellite processing block and AQUASAFE block:
• Satellite processing block (composed of ESA Free toolboxes) is a very focused block for automated retrieval and processing of sentinel2 data in the area of interest. Presently this block generates biophysical vegetation status indicators, dynamic cropland masks and cultivated crop type, based on optical data from Sentinel 2.
• Aquasafe is a very vast block for operating measured data (sensors, remote sensing), modelled data (eg, meteorology forecast, soil/plant/air model, hydrology, water supply, wastewater, etc.) and users (permissions to access data, distribution lists, contacts, etc). AQUASAFE can integrate data from Sentinel 2, meteorological models, meteorological measurements and plant growth models to provide modelling and forecast results about plant and soil. Input/output interface versatility of the AQUASAFE system allows managing different models and data.
Space Added Value
Sentinel 2 optical data (and also Landsat 8) are the corner stone of the system, allowing for the remote monitoring of vegetation. However, the system can grow to access more detailed satellite data. It can even grow to use drone data, which is becoming generalized through platforms like DroneDeploy that can provide data through a dedicated API.
The service is based on models and local measurements. Models are limited by their input. For example, if a soil is not detailed, variations in production due to soil changes will not be modelled. Local ground truth is limited due to its specific nature. For example, if a soil moisture probe is positioned in an area that accumulates water, extrapolations will result in over estimation of available soil water. Satellite data provides a seamless monitoring of the field that is complemented with the high accuracy of ground truth and forecast capacity of the models.
Current Status
A Feasibility study gathered requirements from different users. The tile 29SND from sentinel2 was used as testing area. This area has some of the most productive agriculture areas in Portugal. This area is in the transition between three differentiated and important agriculture areas in Portugal: Oeste, Lisboa e Vale do Tejo (LVT) and Alentejo. Oeste has important areas of fruticulture and horticulture. LVT has important areas of tomato, corn and maize. Finally Alentejo includes production of vines, olive trees and cork trees (this last associated normally with pasture).
Agricultural areas were identified through a Land Parcel Identification System (LPIS). These polygons have information on types of crops per year. This means that these polygons can be a good data segmentation tool to provide information to farmers.
Hidromod is preparing the continuation of AQUAFARM with a demonstration project to monitor crop development at National scale in each of the parcels of the Land Parcel Identification System (LPIS), and the respective integration with models. This will generate statistic data on crop development for each of the 4.5 million parcels nationwide.