Objectives of the service
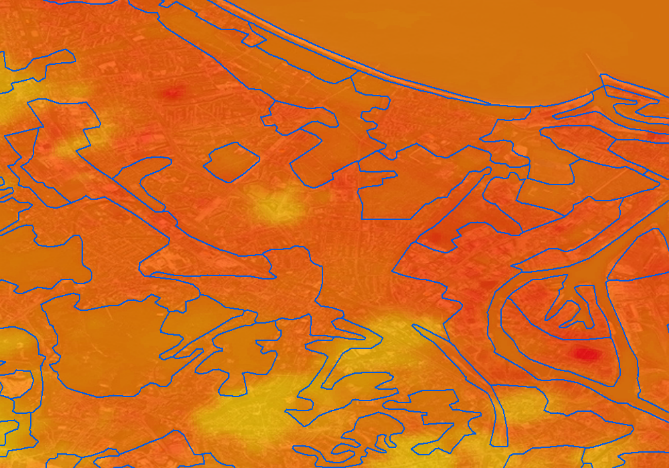
TILQ-AP – is a cloud based platform which calculates temperature distribution maps for cities in near-real time. It uses high resolution spatial imagery which are converted to Air Temperature (AT) maps by dedicated algorithms.
Through its API it provides a better understanding of “heat islands” formations in cities that intensify summer heat waves, especially dangerous for elderly people.
With the use of an algorithm that combines satellite data (meteorological, thermal satellite imagery, etc.) with terrestrial data from weather, landform and terrain data (especially urban development) and resident statistics - it is possible to monitor and analyse city heating up in a continuous and repetitive way.
All this can help users (e.g. city authorities) to identify areas that are particularly hazardous to elderly people during heatwaves, to counteract heat (e.g., by enhancing support activities in the area) and to check their effectiveness.
Users and their needs
- Local Government:
Local authorities have the greatest influence on the spatial development policy of their territory. TILQ-AP provides them with insights into types of places where heat islands are created, allowing future urban developments to avoid causing them. At the same time, areas where undesirable phenomena already occur can be monitored, allowing to reduce their intensity, and increase counteracting efficiency and monitoring effectiveness.
- Medical Services:
It is very important for medical services to know the areas in which the heatwave affects local population. TILQ-AP supports the counteract preparations for increased risk of stroke, heart attack, fainting, etc. This allows to prepare appropriate resources in nearby medical facilities and hospitals.
- Local Communities and NGOs:
A timely warning of a forthcoming heatwave and timely delivery to the appropriate local community and NGOs supports counteract activities, such as: going out of town, going to air-conditioned places (cinemas, theatres), gathering an adequate supply of cool drinks, etc.
All areas of the world where heat issues are present.
Service/ system concept
The system collects and combines data from different sources:
- Satellite Data
- Thermal satellite images (Landsat, Sentinel when available)
- Meteorological (when local data is not available or not good enough)
- RGB and SAR satellite images (for Land Cover and Urban data when other sources are not available)
- Ground Data
- Meteorological (from local meteo-stations)
- GIS/terrestrial data (land cover, landform, buildings, etc.)
- Statistical Data
- Density and distribution of population
- Age structure of population
All data is collected continuously for the area of interest (a whole city or region).
This enables a real-time monitoring of heat islands during heat waves in cities. At the same time, a model is being developed to predict the appearance of the heat island in the future. This allows the authorities or the local population to be warned about the hazard.
Within the framework of the project, an API will allow to generate heat maps for the indicated area from historical and current data.
Space Added Value
Satellite data is the absolute foundation of the TILQ-AP project. It is assumed that all land temperature, land cover, building, etc. data will eventually come from satellite data sources without the need for terrestrial data. These assumptions will create a universal system that can be used in any part of the world. This allows a better use of data from Sentinel satellites (and more) to protect the health and life of the elderly population.
Satellite data to be used in the project:
- Thermal imagery
- RGB imagery
- SAR imagery
- Meteorological data
Current Status
The Feasibility Study has been completed successfully. A follow up demonstration project is under consideration.