Objectives of the service
The OTAM project is an oil market data analytics solution in form of a SaaS platform with the aim to create more transparency in an otherwise opaque oil field and oil refinery monitoring market. Using optical satellite imagery, a new dataset is generated for oil field and oil refinery monitoring. Our new oil field and oil refinery monitor capability offers daily data for significant oil fields and oil refineries in 19 countries. Hence it leads to better decision making and more transparent markets. The resulting user interface is a separate application in the OilX Platform (see here for more information https://www.oilx.co/platform).
Users and their needs
OTAM targets the global oil market, more precisely oil traders and oil analysts. The current system of monitoring oil fields and oil refineries, largely depends on having “boots on the ground” or on reports from national agencies and oil companies. The benefits of using OTAM are clear, as it provides unbiased, rapid, and science-supported observations on the operational status of oil fields and oil refineries.
The end users and their needs are:
-
Oil Majors, Trading Houses, Investment Banks, National/Integrated Oil Companies: Independent and timely assessment of asset performance at oil fields and refineries to ensure their ability to immediately respond to supply chain issues.
-
Hedge Funds: Fast-moving data is required to give up to date clarity on the status of the oil market through an independent oil stock data provider and to gain access to oil-major-grade insight through independently derived datasets.
-
Refinery Companies: General clarity on status of oil refining through an independent oil data provider to shape and inform downstream market considerations.
-
Various uses (Governments, Asset Manager, Private Equity, Consultancies, Airlines, Utilities): Independent and timely assessment of asset performance at oil fields and refineries to ensure their ability to immediately respond to supply chain issues.
The use of near real-time reporting through a SaaS dashboard allows the data sets and raw optical images to be transformed into meaningful and readable data; this client sector contains service users that may lack specific oil market expertise.
Service/ system concept
OilX’s OTAM interface is developed as a data subscription service in the form of an app for oil field and oil refinery monitoring, which utilizes Sat-EO data for the most significant crude oil producing. The user can choose between 3 granularities: at oil field level, at the exporting port level, and at country level. The flaring data is optimally fused and contextualised with SAR and AIS data to be presented to the targeted user group of oil traders and oil analysts.
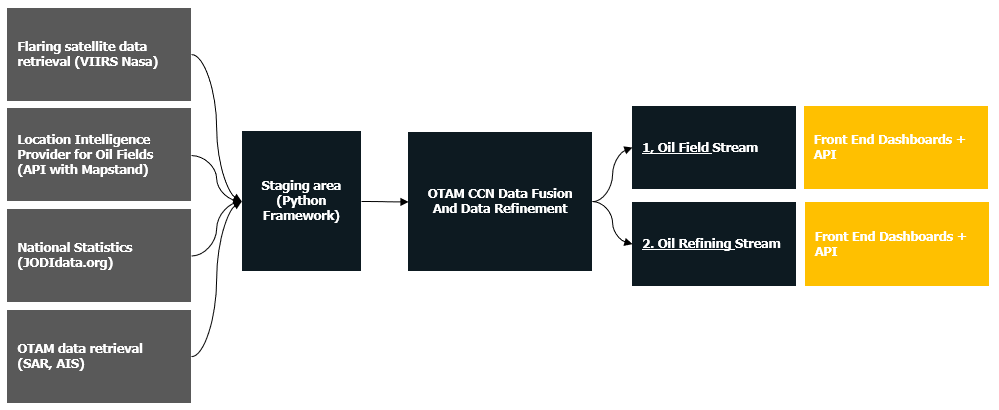
The system’s building blocks are:
-
Two different data sources:
-
National Statistics and static map data
-
Satellite based data from VIIRS, SAR and AIS data
-
-
Data fusion and Machine Learning Algorithms
-
Contextualised dashboards to present the fused data.
Space Added Value
The vision is an entirely independent, accurate, complete, real-time source of data for oil markets to improve transparency and increase efficiency in oil markets. To achieve that, OTAM is based on two main pillars:
-
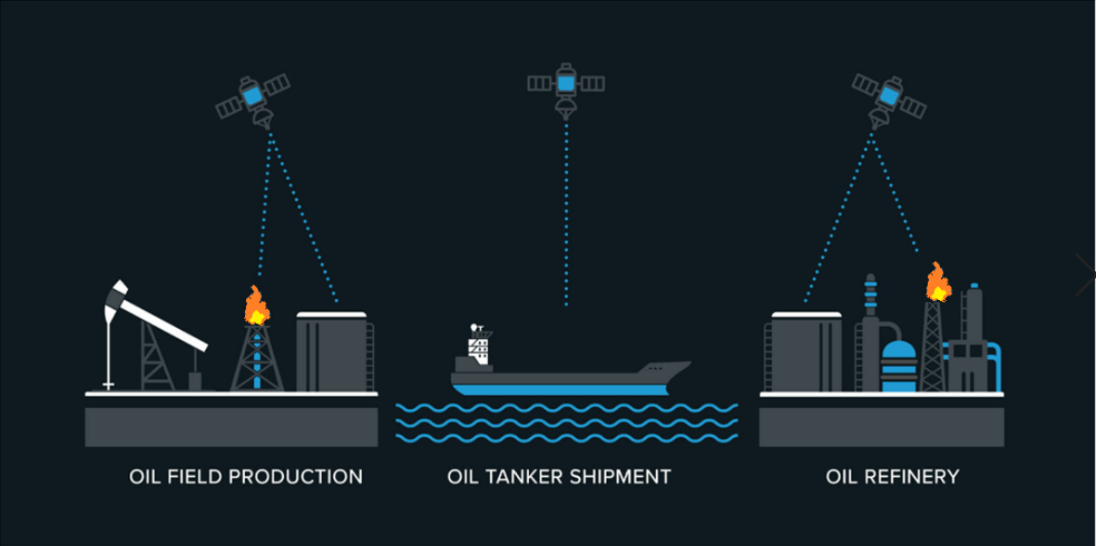
Exploitation of optical satellite imagery to track the flaring activity of oil fields and oil refineries, and
-
Integration of this new flaring dataset into the OilX platform to track supply/demand balances of oil markets.
The above pillars combined, help monitoring the full cycle of the oil supply chain and offer actionable insights to oil traders, in almost real time, opposed to the traditional time-lagged ways of national reports.
Current Status
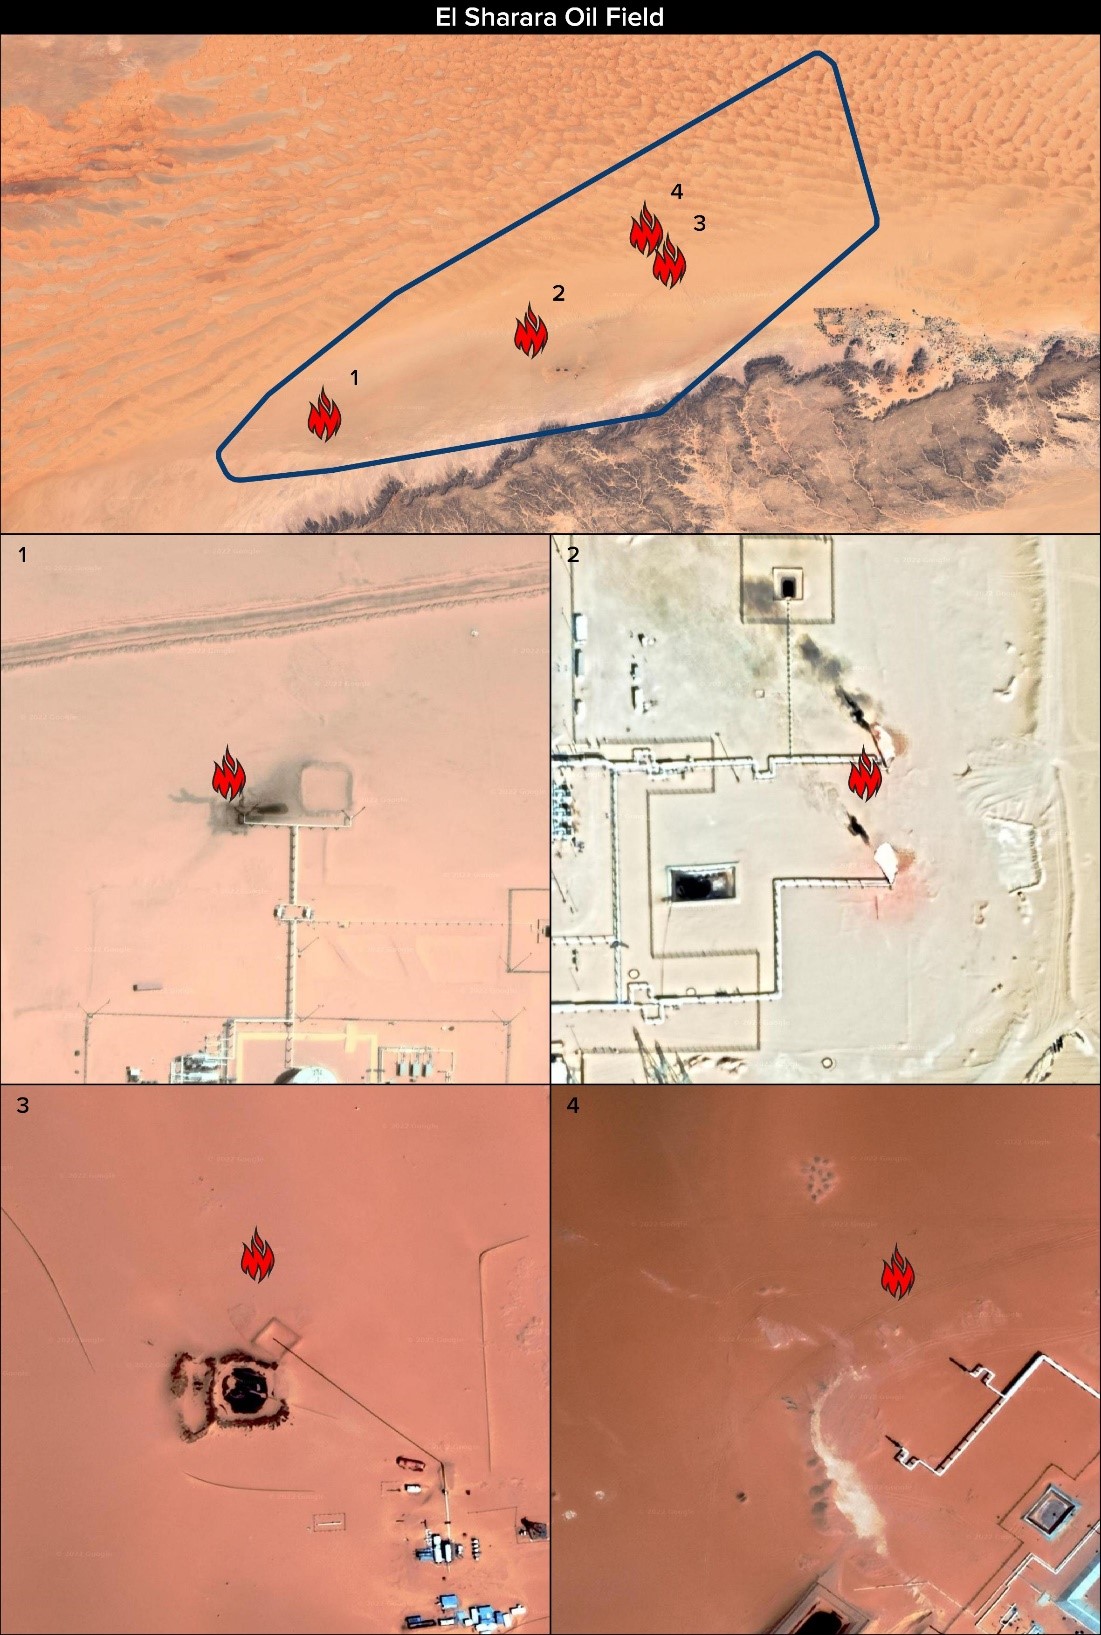
The initial round of oil field monitoring includes 500+ oil fields in 19 countries. On a daily basis, all 500+ oil fields are monitored and the observations for their operational status are used by oil analysts and oil traders to inform more accurate decision-making.
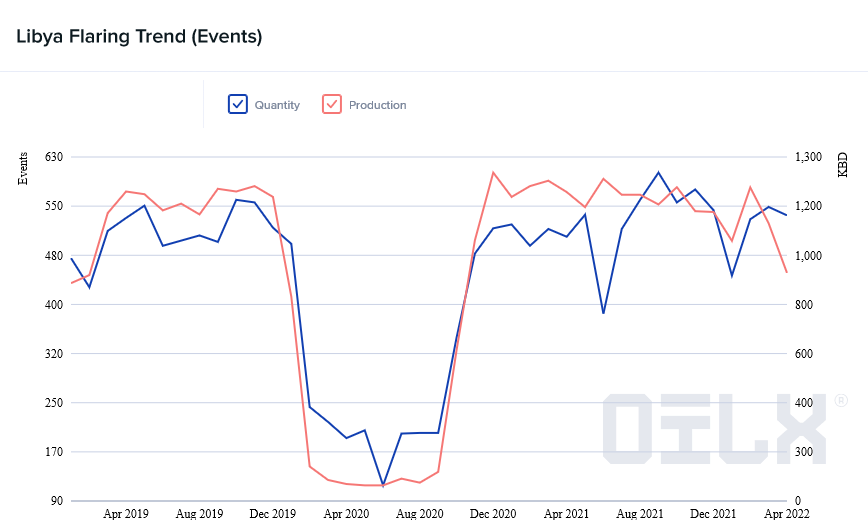
Furthermore, time series of each oil field’s flaring activity have been generated, using optical satellite imagery. The flaring dataset that is produced by OilX has been backtested against national statistics and OilX’s reports of oil production.
