



Objectives of the service
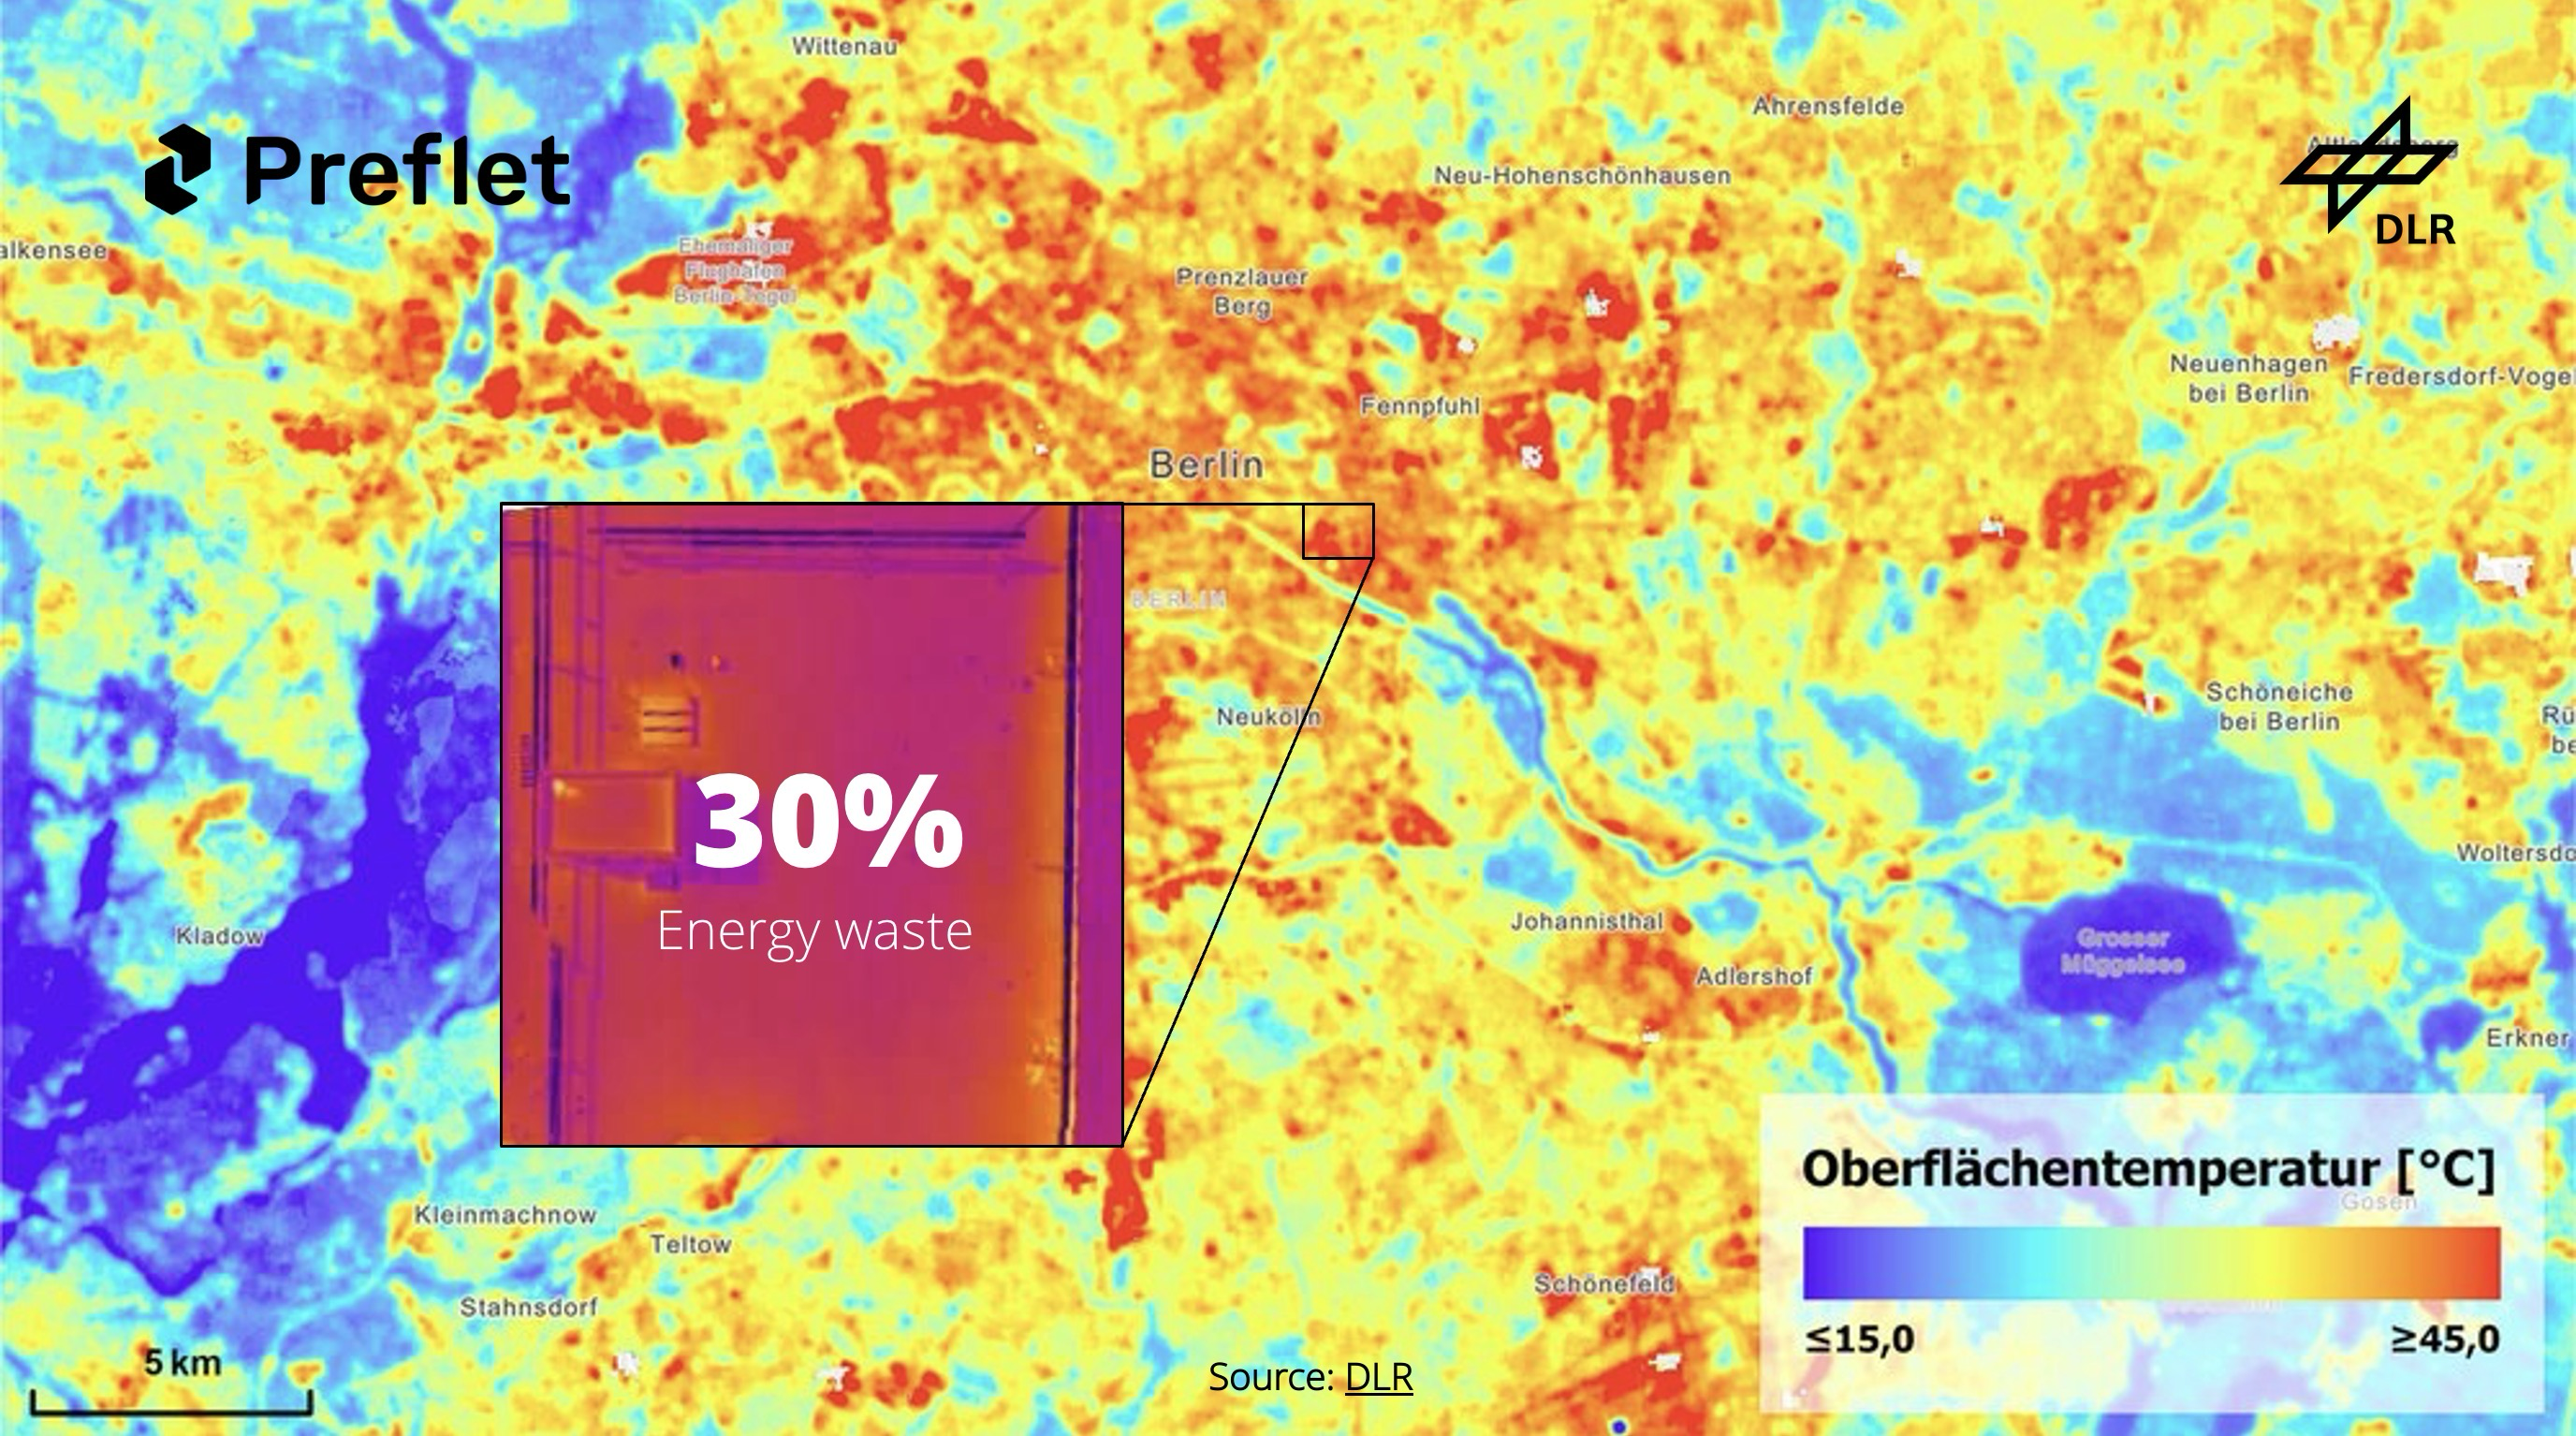
The objective of the service is to give building owners and portfolio managers a fast, scalable, and data-driven way to identify buildings that may have high heat-loss potential. Instead of waiting for manual audits across every site, the service uses satellite thermal context, live energy data, weather response, and building metadata to create a prioritised view of where attention is most needed.
The service is designed to support early-stage screening, not to replace detailed engineering assessments. It helps users decide which buildings should be investigated first, where further audits may deliver the most value, and how energy-efficiency investment can be planned across a portfolio.
Through the frontend APIs, the service presents complex analysis in a simple format: a heat-loss risk index, a risk band, score contributions, weather-response evidence, satellite context, and building data. This allows users to understand both the final result and the reason behind it.
By combining automated analytics with satellite-assisted evidence, the service helps organisations reduce uncertainty, target resources more effectively, lower energy costs, improve building performance, and progress toward sustainability goals.
Users and their needs
The primary customers are private building owners and asset managers, who need portfolio‑level visibility and cost‑efficient ways to identify inefficient buildings. Public‑sector administrators also represent a major user group, as they must meet national energy‑efficiency requirements with limited budgets and staff.
Within these organisations, the main users include energy managers, who require transparent, actionable insights to validate energy‑saving actions; facility managers, who need simple visual guidance and automated alerts to reduce manual workload; and sustainability/ESG specialists, who depend on accurate, audit‑ready data for regulatory reporting. These target users manage building portfolios across Germany, France, and Italy.
User needs:
-
Fast, remote screening of heat‑loss across large portfolios
-
Low‑CAPEX assessments that scale without on‑site audits
-
Clear explanations and automated analysis for decision‑making
-
Visual heat‑loss maps and simple operational guidance
-
Verifiable emissions and performance data for SFDR/ESRS reporting
Key challenges:
Meeting accuracy expectations across diverse building types, integrating fragmented data sources, and delivering insights that are simple enough for daily operational use while robust enough for compliance reporting.
Service/ system concept
The satellite data-based heat‑loss detection provides users with remote assessment, visual building comparisons, and clear recommendations on where energy is being wasted across large portfolios. Users receive heat‑loss maps, building‑level performance scores, automated analysis of likely inefficiencies, and simple guidance on which buildings should be prioritised for renovation or deeper assessment.
The system works by combining satellite images, building characteristics, and environmental information. An AI model analyses these inputs to detect heat‑loss patterns and estimate the relative performance of each building. The results are delivered through an online dashboard or downloadable reports, allowing users to explore their portfolio, compare buildings, and track improvements over time.
At a high level, the architecture includes three layers:
-
Data Layer – Ingests Earth Observation imagery (e.g., Landsat 8/9), building footprints, weather data and energy‑related metadata to create a unified, multi‑source dataset.
-
Processing Layer – Applies thermal conversions, spatial context modelling, energy‑weather trend analysis and automated diagnostics to identify heat‑loss indicators and generate the Heat‑Loss Risk Index.
-
User Layer – Presents insights through a simple, explainable interface with maps, rankings, score breakdowns and recommendations, supported by Agentic AI for natural‑language explanations.
This structure ensures the service is scalable, easy to use, and capable of supporting both technical and non‑technical users.
Space Added Value
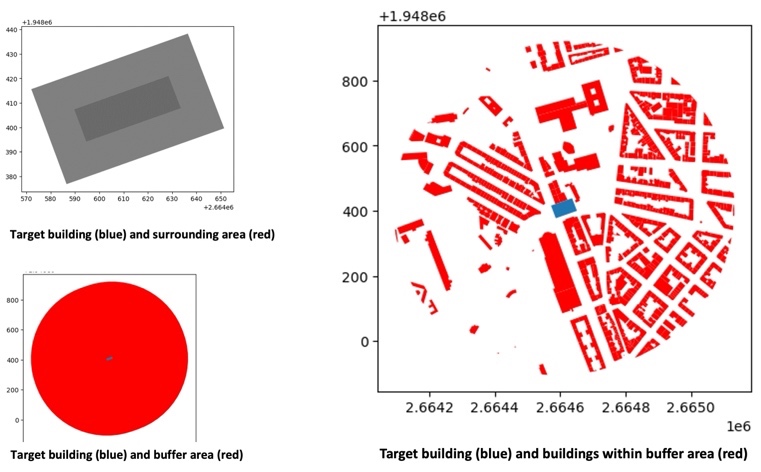
The service uses satellite‑based Earth Observation data to detect heat‑loss patterns and compare building performance across large regions. It automatically retrieves thermal and optical imagery from open‑data sources such as Sentinel‑3, Landsat 8 and Landsat 9 Collection 2 Level‑2, together with land‑cover datasets like CLC2018 and optional high‑resolution drone imagery. The subsystem supports standard geospatial formats including GeoJSON and shapefiles, with full metadata such as acquisition time, sensor parameters and geolocation. A structured workflow searches for suitable scenes, filters cloud‑affected imagery, builds building‑level and neighbourhood‑level comparison areas, extracts thermal and reflectance statistics and returns heatmap URLs, sub‑scores and warnings. Thermal values are converted from Landsat digital numbers into Celsius, and reflectance bands are scaled to compute vegetation, built‑surface and moisture indices. The thermal band provides surface‑temperature context, the red band supports vegetation analysis, the near‑infrared band supports vegetation and built‑surface detection, and the short‑wave infrared band supports built‑surface and moisture detection. The output is not a classified thermal image but a comparison between each building and its surrounding neighbourhood, enabling reliable heat‑loss prioritisation across large portfolios with far greater reach and consistency than ground‑based methods.
Current Status
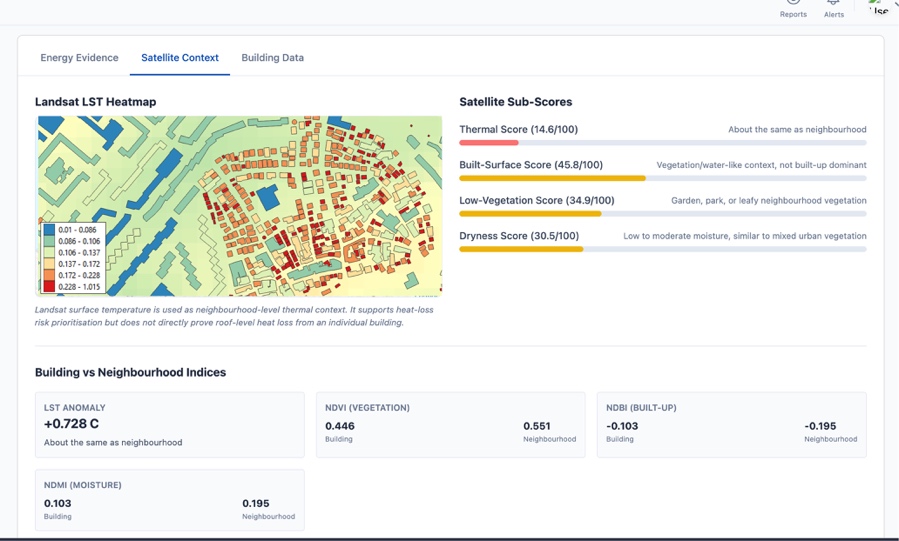
The project has completed its first engagement phase, including interviews with stakeholders across European countries. Satellite datasets through the Microsoft Planetary Computer have been integrated into a pipeline, applies configurable parameters such as cloud‑cover limits and neighbourhood‑comparison size. It is capable of processing imagery at regional scale. The first heat‑loss detection model has been validated through several internal comparison cycles using building metadata and utility benchmarks. A functioning backend APIs include performance definitions, building‑level results, weather‑response evidence and satellite context. The processing workflow includes daily energy‑weather aggregation, heating‑degree calculations, temperature conversion, reflectance scaling, spatial comparison, satellite sub‑scoring, weighted risk scoring, risk‑band assignment and data‑completeness checks. The interface displays the final risk score, contribution breakdowns, weather‑response charts, satellite heatmaps, A reference building analysis in Germany produced a low‑risk result supported by daily energy‑weather observations. Current work focuses on validating representative building configurations. The next step is to launch pilots with real customers to validate results against on‑site observations.
Prime Contractor(s)
