

ESA announces new green finance partnership with UK CGFI
September, 28 / 2023
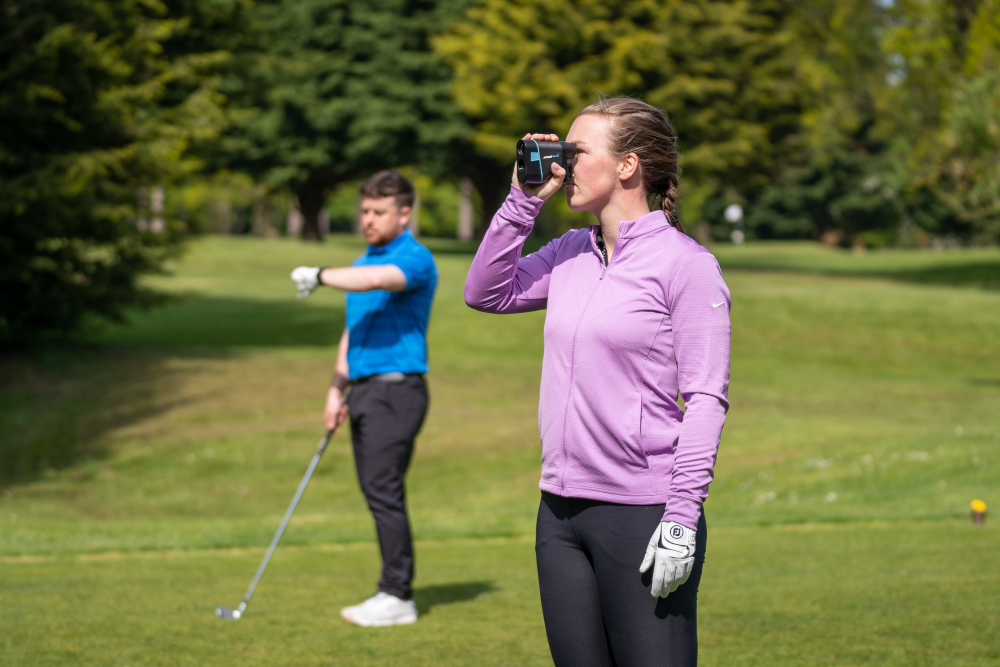
Satellites drive golfing performance success
November, 11 / 2022

Cycling gets smarter with new space-enabled Bluetooth device
July, 6 / 2022

Climate risk monitoring for the commodities market
September, 25 / 2023

Space tech meets HR to revolutionise hiring processes
Recruitment technology start-up MeVitae have been supported by the European Space Agency (ESA) to apply a space engineering solution to hiring. This innovative transferral of space technology is now helping organisations to remove biases and develop more inclusive and diverse workforces.
Hiring decisions impact everything a company does, yet these crucial choices are often clouded with the limitations of human decision-making, called cognitive (or unconscious) biases. As leaders are grasping the importance of embedding diversity into their workforce, not just to reach diversity goals, but for performance outcomes, there is a surging demand for technological solutions to help organisations achieve ‘blind’ recruitment.
Based in Oxford, UK, MeVitae was founded by a neuroscientist and a computer scientist who set out to provide an AI-powered blind recruiting solution, mitigating algorithmic and unconscious biases from job applications. However, as a small team, MeVitae needed funding and expertise to develop their vision into a tangible prototype. That’s where ESA Business Applications came in, to support MeVitae and deliver a never-seen-before application of space technology into the world of human resources (HR).
Riham Satti, CEO and co-founder of MeVitae said: “Pairing with ESA really skyrocketed our capabilities in the development phase and helped us build the products that companies are using today.”
Pivoting a space technology
Over 18 months, ESA’s financial support and expertise enabled MeVitae to harness a powerful technology originally developed by ESA to analyse telemetry data to detect faults in space equipment. Together, MeVitae and ESA pivoted the technology to analyse typical hiring patterns, to identify anomalies and undetected biases. This helps organisations to understand their past hiring behaviours and improve their recruitment performance.
“The issue of diversity in recruitment and hiring practices is one of the biggest being faced nowadays, particularly for those recruiting and hiring within technical industries. We’re proud to have supported the MeVitae team to marry space tech with HR, addressing the United Nations’ Sustainable Development Goal on gender equality in a unique way.” commented Rita Rinaldo, Head of Projects and Studies Implementation Division at ESA.
Using technology for good
Together with the anomaly-searching capabilities based on ESA technology, MeVitae offer companies a recruitment platform plugged into the leading Application Tracking Systems. This enables recruiters to automatically redact over 20 types of information from job applications that could be subject to bias, including name, gender, and university, in any type of application document, including CVs and covering letters.
“The hiring process plays a pinnacle role in developing diverse teams and our work is relevant now, more than ever. We are proud to offer organisations a proven method of driving diversity in the workplace, with our clients reporting increases of more than 30% in gender and ethnic diversity since using our Blind Recruiting solution,” said Riham.
In succession with the ESA project, MeVitae entered the US market, growing by 200% over the last year. Moreover, the company closed an investment round in just three weeks, before adding Microsoft and Oracle to their list of partners. This will enable the company to continue scaling, embarking on operating globally to keep up with its increasing demand.

Autonomous shuttle launched at Harwell Campus
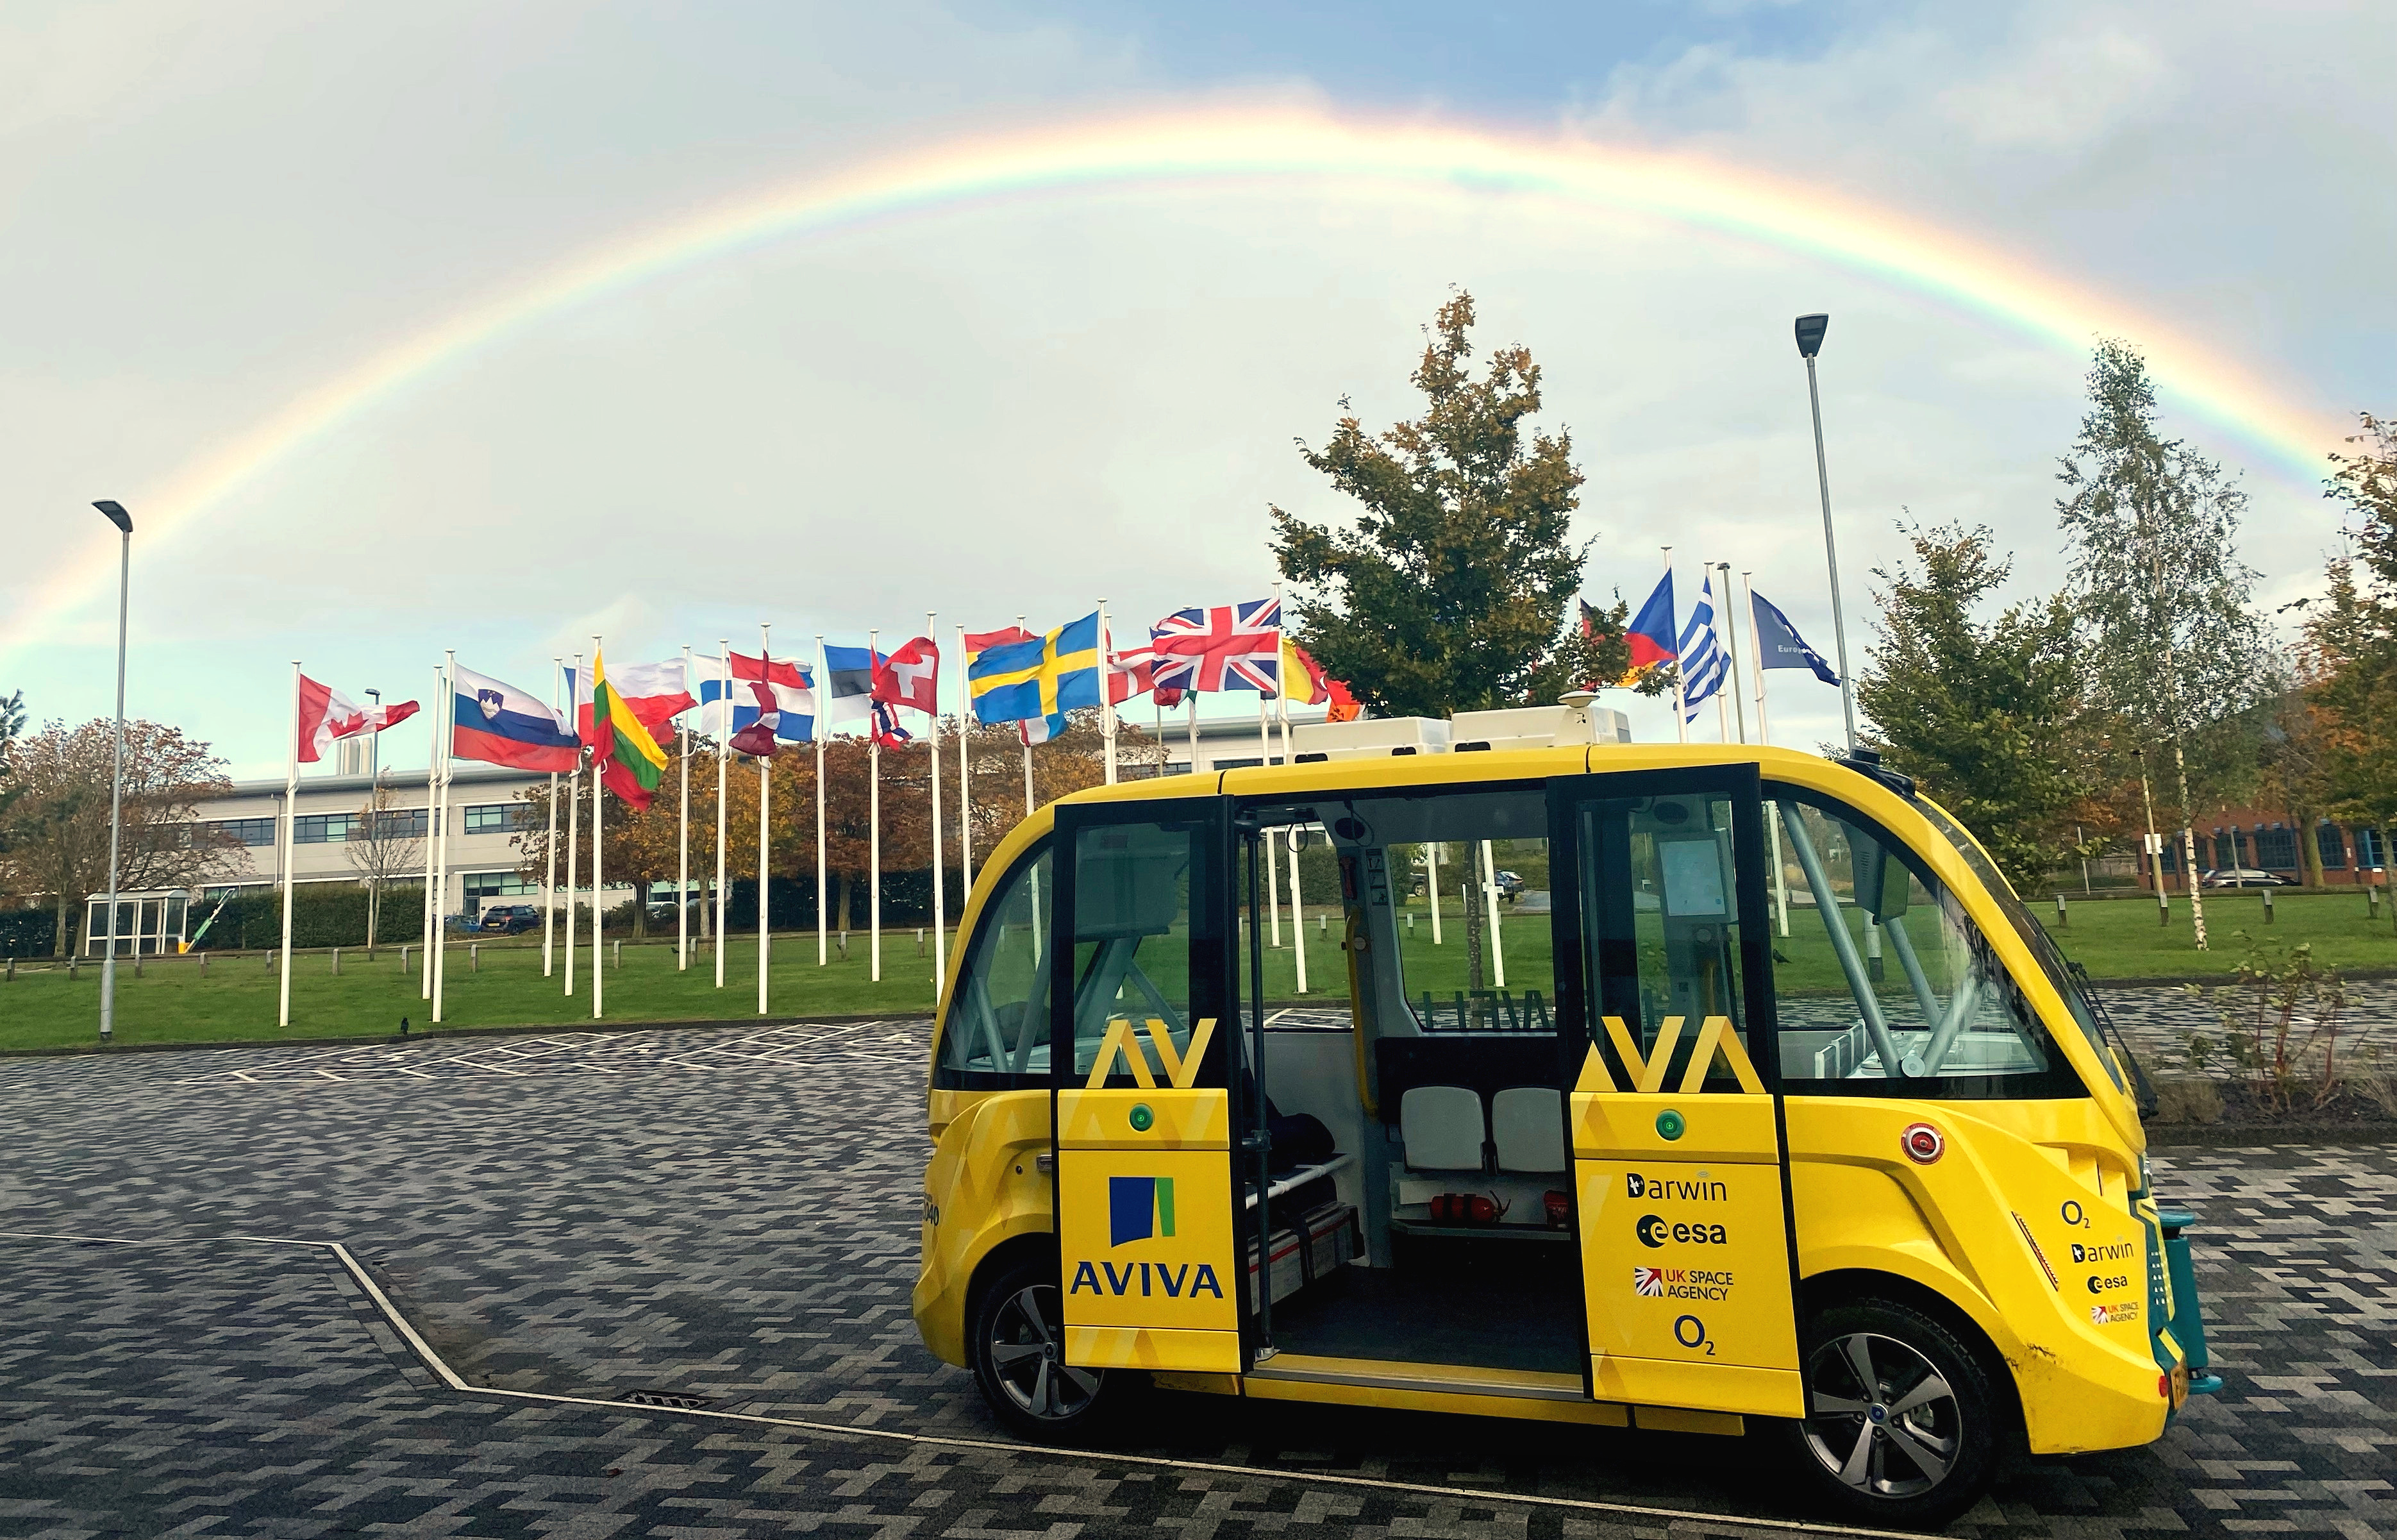
UK start-up Darwin Innovation Group has recently launched a fully autonomous passenger shuttle at Harwell Campus, that is utilising integrated satellite and 5G communications for seamless operation. With the support of ESA and the UK Space Agency, the 1-year pilot phase of the project will demonstrate the performance of such vehicles in a real-world environment and investigate all related aspects, including user demand and insurance.
Visitors and staff at Harwell Science and Innovation Campus, Oxfordshire, will be the first in the UK to be able to use the autonomous shuttle. The service is run by Darwin on two separate routes across campus, both of which begin at ESA’s European Centre for Space Applications and Telecommunications (ECSAT). The service was launched during an event held at ECSAT at the end of November.
Staying connected
Autonomous vehicles rely on terrestrial networks to stay connected. However, this prevents them from being used in those locations where the networks are unreliable or non-existent, which includes many rural areas. By integrating satellite communications with 5G, the resulting ubiquitous connectivity offers the potential for self-driving vehicles to operate in any location.
Darwin Innovation Group’s shuttle transmits data in real time via 5G networks and satellite communications channels. Its 1-year pilot phase will demonstrate how self-driving vehicles operate in a real-world setting. Telematics data is transmitted via mobile operator O2 5G networks and a geostationary satellite operated by HISPASAT. Although the shuttle is autonomous, there will be an operator on board throughout the trial with access to safety controls.
The shuttle was built by Navya and uses LiDAR sensors, cameras and ultrasound to navigate around obstacles, plus a GNSS satellite antenna for positioning data. It also uses technology developed for Darwin’s self-driving car, also supported by ESA and the UK Space Agency. By integrating the Darwin technology stack and fleet management platform, Darwin is tracking the shuttle as it travels around Harwell Campus and gathering operational data that will help it create a minimum viable product. The aim is to increase confidence in operating autonomous shuttles on public roads and provide information to both regulatory bodies and companies involved in all aspects of future commercial services, such as insurance companies.
Greener public transport
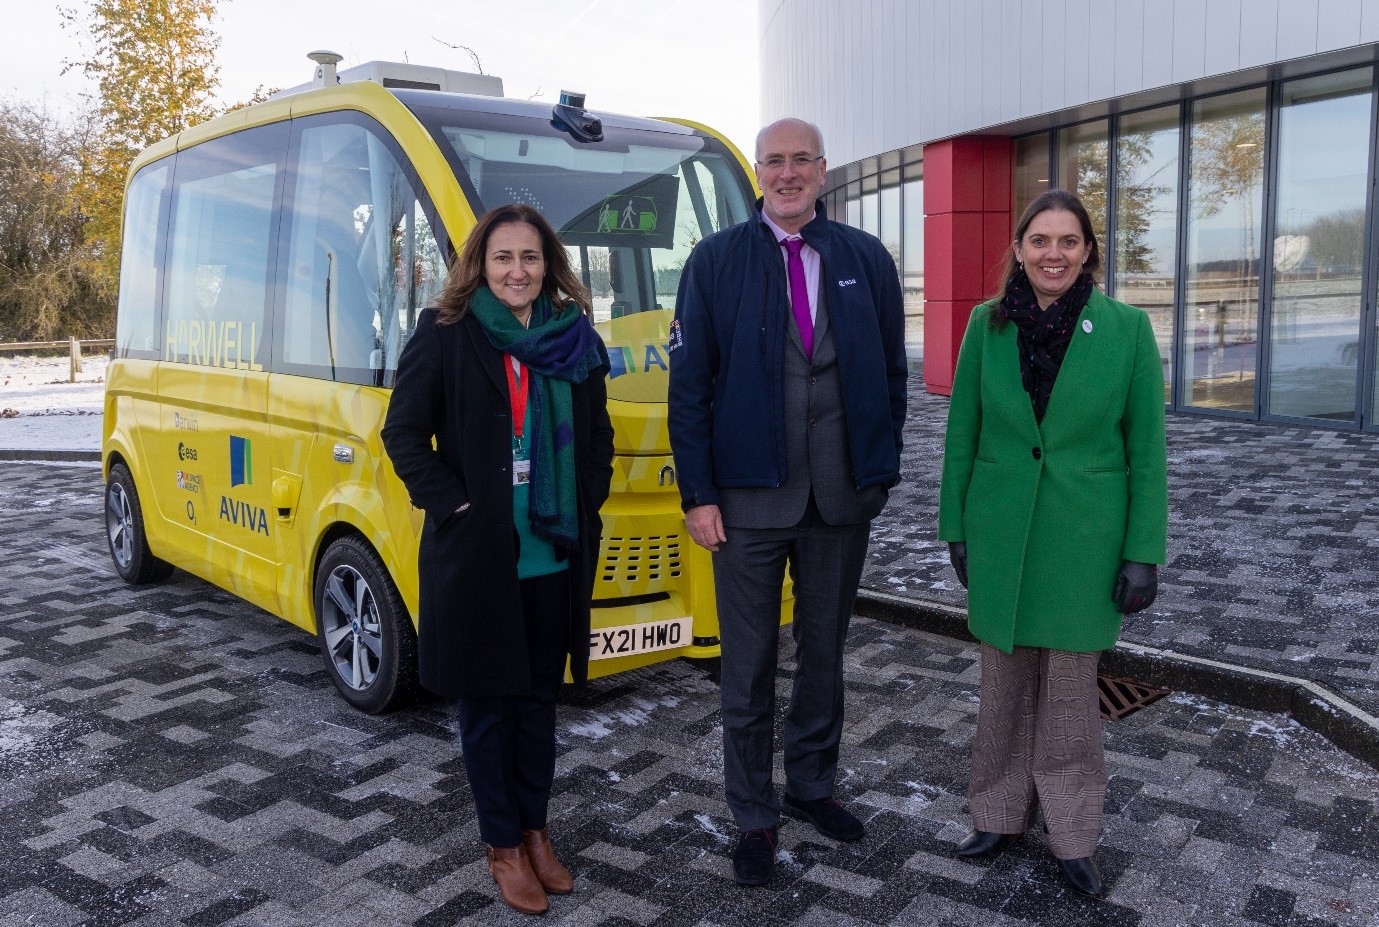
The trial marks a step forward in providing greener public transport in the UK, as noted by the UK’s Science Minister George Freeman, during a visit to Harwell Campus and ECSAT. The shuttle is battery powered and emits zero carbon.
Any wider adoption of similar autonomous public transport vehicles could help the UK in its efforts to meet its emissions targets. It could also contribute to cleaner air initiatives and bids to reduce traffic noise. On the Harwell Campus, where the trial is operating a free service during weekdays, it is providing an easier way for people to access campus amenities, including leisure services, and reducing the number of cars, helping to reduce traffic accidents.
ESA is stepping up its efforts to use space to combat the climate crisis through Agenda 2025 and has launched three accelerators to unite European space actors, including “Space for a green future”.
Ubiquitous connectivity for transport
The autonomous shuttle is also of interest for ESA because hybrid satellite-terrestrial networks present opportunities to provide ubiquitous coverage, seamless connectivity, and network resilience. Transport is one of the vertical markets that ESA has identified as having the potential to benefit from this in the future. ‘Space for 5G and 6G’ is a Strategic Programme Line for ESA within the ARTES 4.0 funding programme.
Elodie Viau, ESA’s Director of Telecommunications and Integrated Applications, said: “5G, and soon 6G, is set to transform society. For this to happen, communications networks in space have to be integrated with terrestrial ones. ESA is excited to champion the Harwell shuttle service, a project that will both showcase the reliable, instant 5G connectivity delivered by converged space and ground telecommunications networks and bring low-emissions, autonomous vehicles to the roads.”
The autonomous shuttle has already provoked interest in running similar services elsewhere in the UK. The Highlands and Islands Transport Partnership, HITRANS, for example, is interested in a trial with a view to adopting a similar service at Inverness Airport in Scotland.